Yes you heard it here first, Room 5 are learning to be Data Detectives.
The ultimate goal of a statistical investigation is to learn more about a real-world situation by following a set process of gathering, displaying and interpreting data.
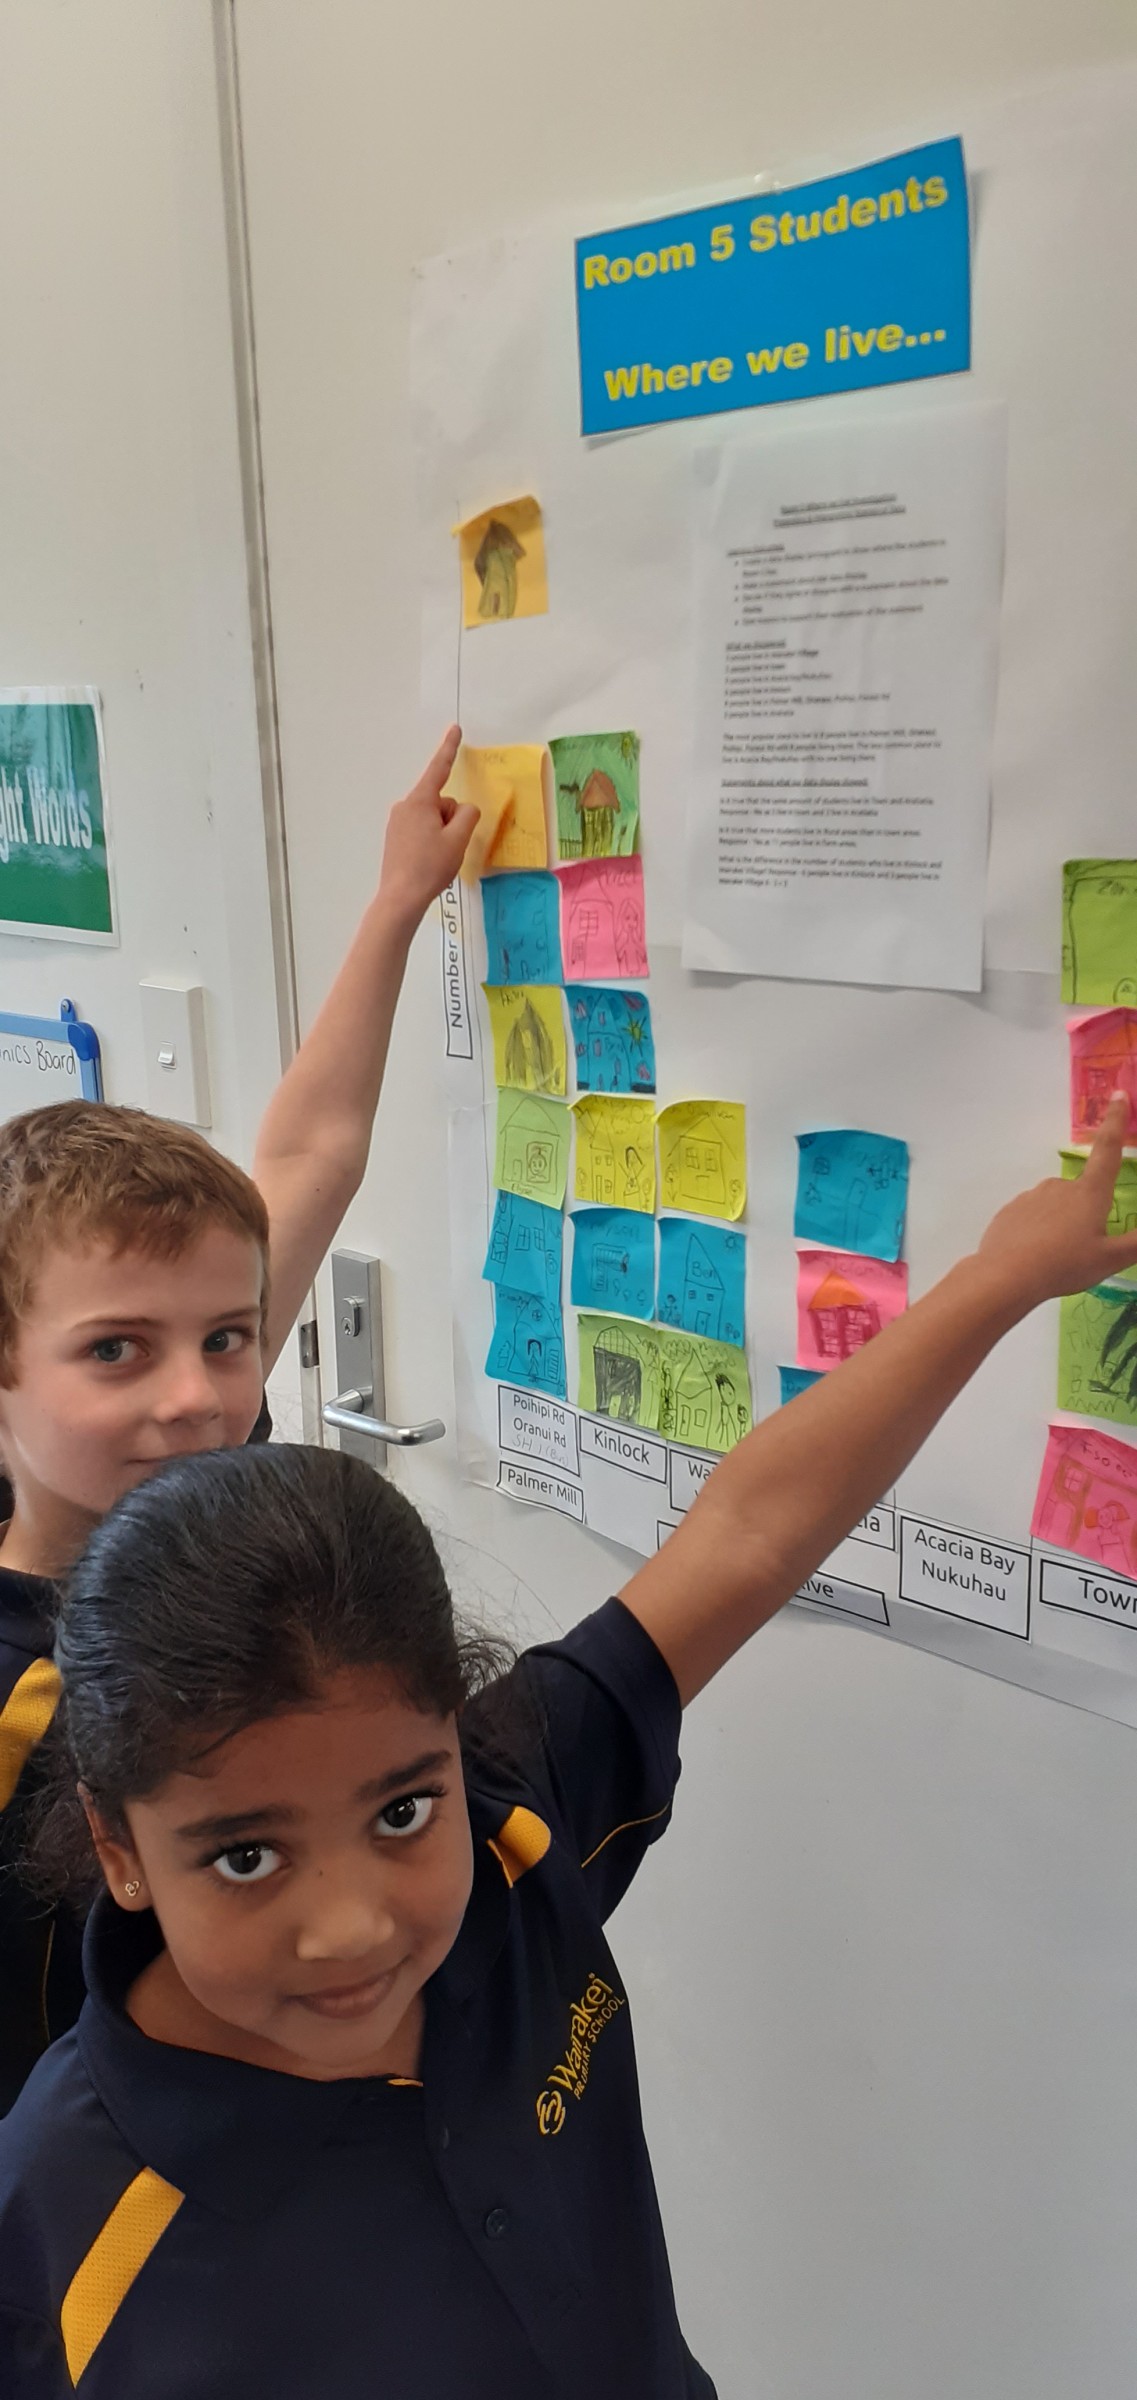
Our “Taupō - moving with the Times” inquiry statistics focus - where students will learn to conduct investigations using the statistical enquiry cycle; pose and answer questions; gather, sort and display category data; and finally discuss the results.
Our combined focus will be on collecting information about our homes, families, school and also what makes Taupō a special place for us to live.
Students have been immersed in data learning about how to conduct a statistical investigation. It starts with a question - what is it we would like to find out?
Room 5 have investigated questions about ourselves and our town such as what month is the most popular for birthdays; is country/rural or town a more popular place to live and what does family mean in our class (who lives with you at your house).
We also considered favourite places to play at school and favourite places to visit in Taupō. We collected information from the students in the class using a pictogram.
After collecting the data I posed questions for the students. They had to use the pictograph to answer the questions and provide evidence to support their findings.
We considered the most popular and least popular options. We also had to consider true/false statements and ‘difference’ questions.
Favourite places to play
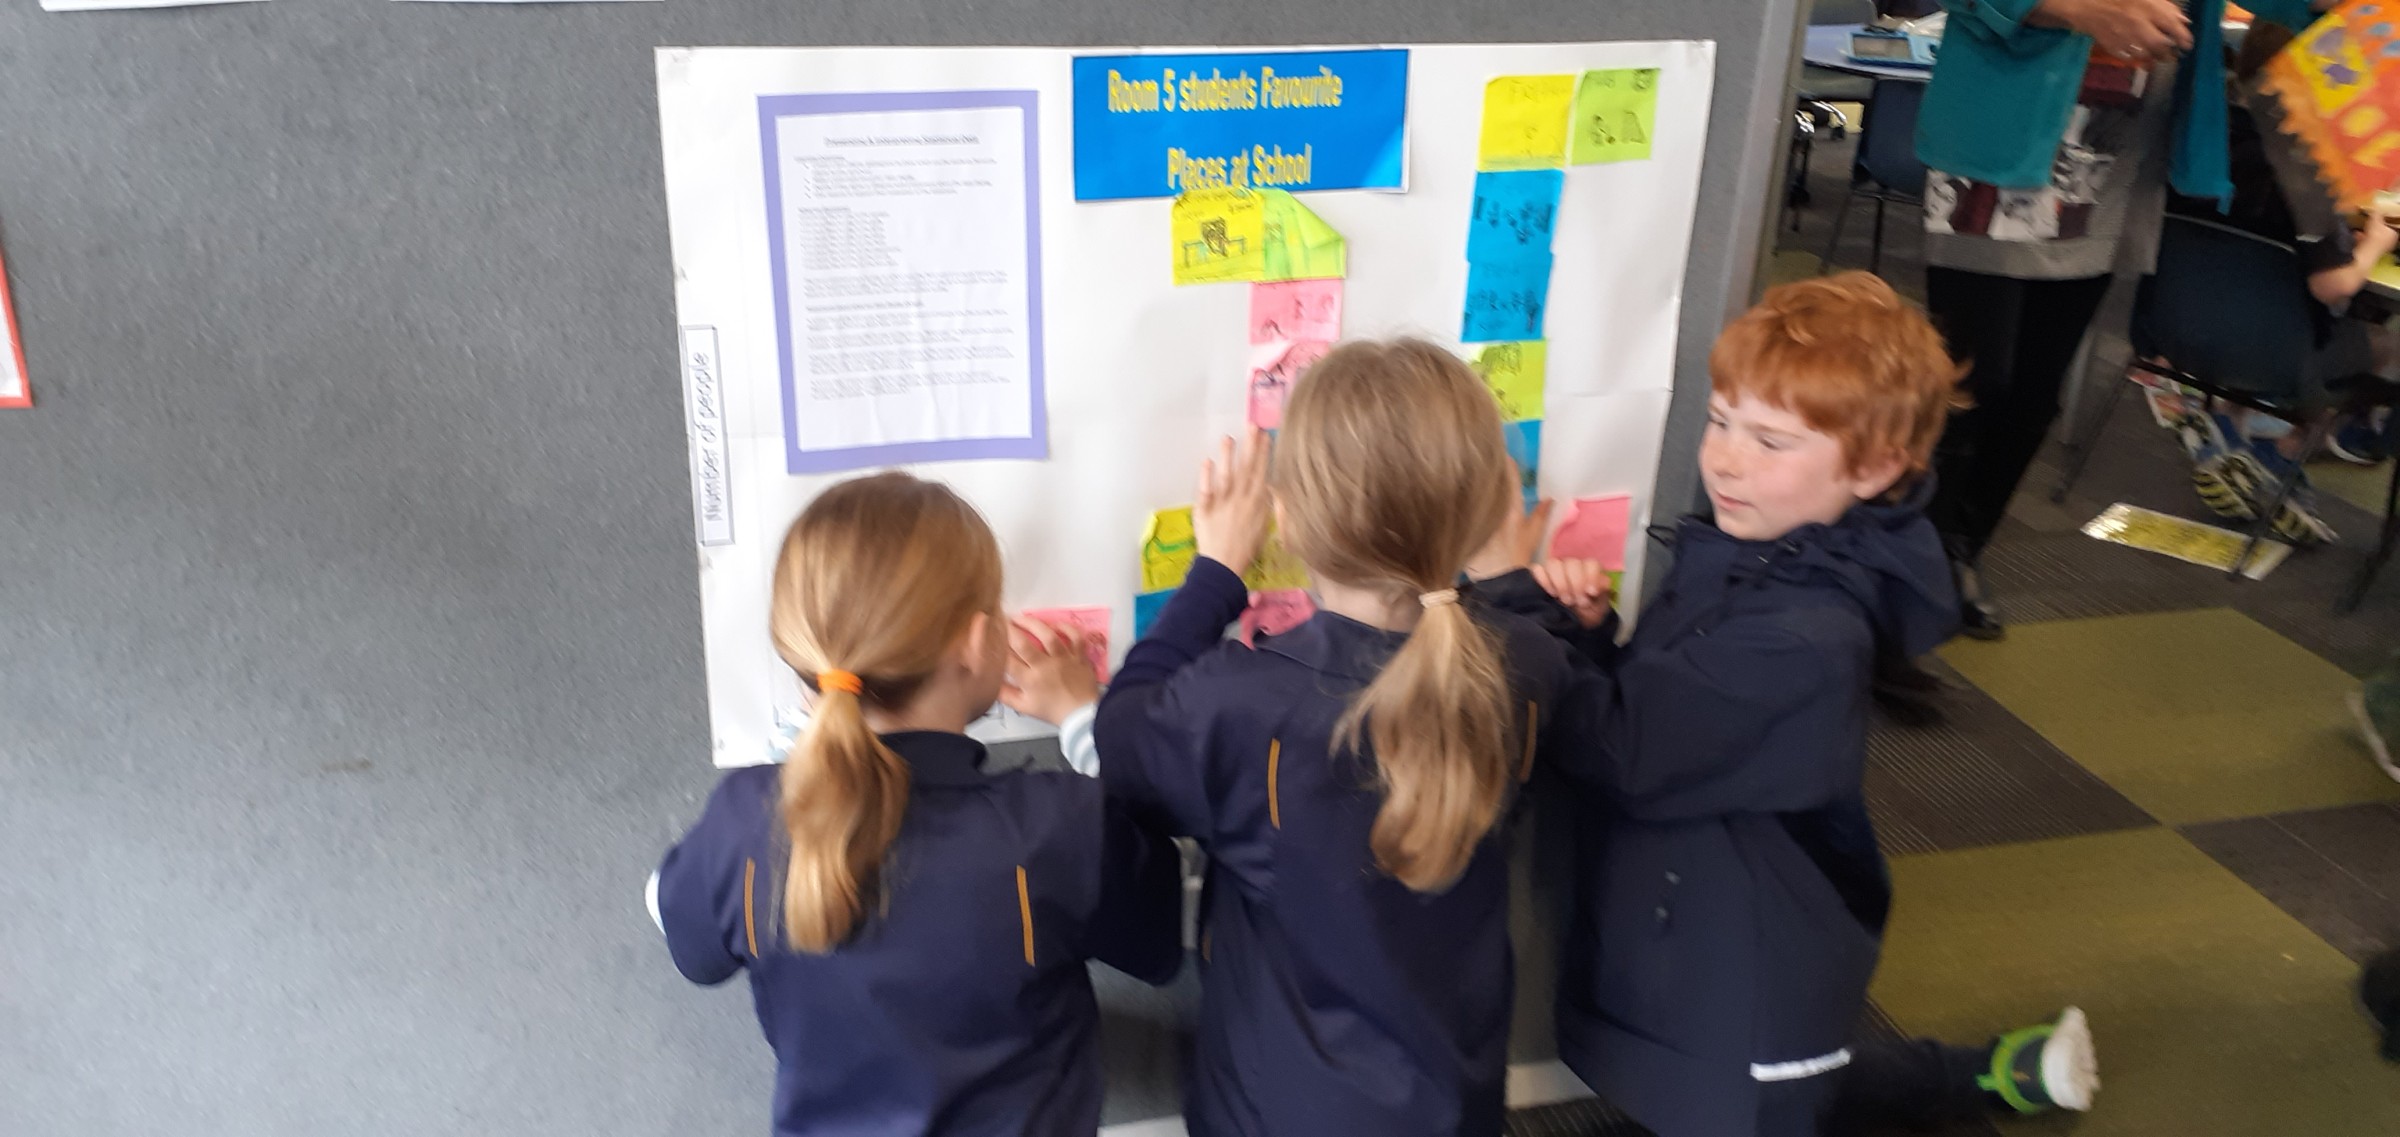
The most common place to play at school was the field with 8 students thinking that was the best place to play.
The least common place to play at school was the sandpit because no one chose that as their favourite place to play.
Question: Is it true that 5 people like to play on the courts. Response - no because there are only 2 people who chose the courts as their favourite place to play.
Question: What is the difference in the number of people who like to play on the field and those that like to play in the maze. Response - 8 people like to play on the field and 2 people like to play in the maze. The difference is 6.
Statistical investigation questions
Grayson - what is your favourite NPC rugby team?
Riley - what is your favourite breed of dog?
Segev - what pets do you have at home?
Linaya - what is your favourite colour?
Lisette - what is your favourite horse breed?
Lydia - what is your favourite NZ native animal?
Keywords: pose questions, collect data, display data, tally chart, pictograph, bar graph, difference, horizontal & vertical axis, statistical investigation, true/false statements, opinions
Comments are disabled for this post.