
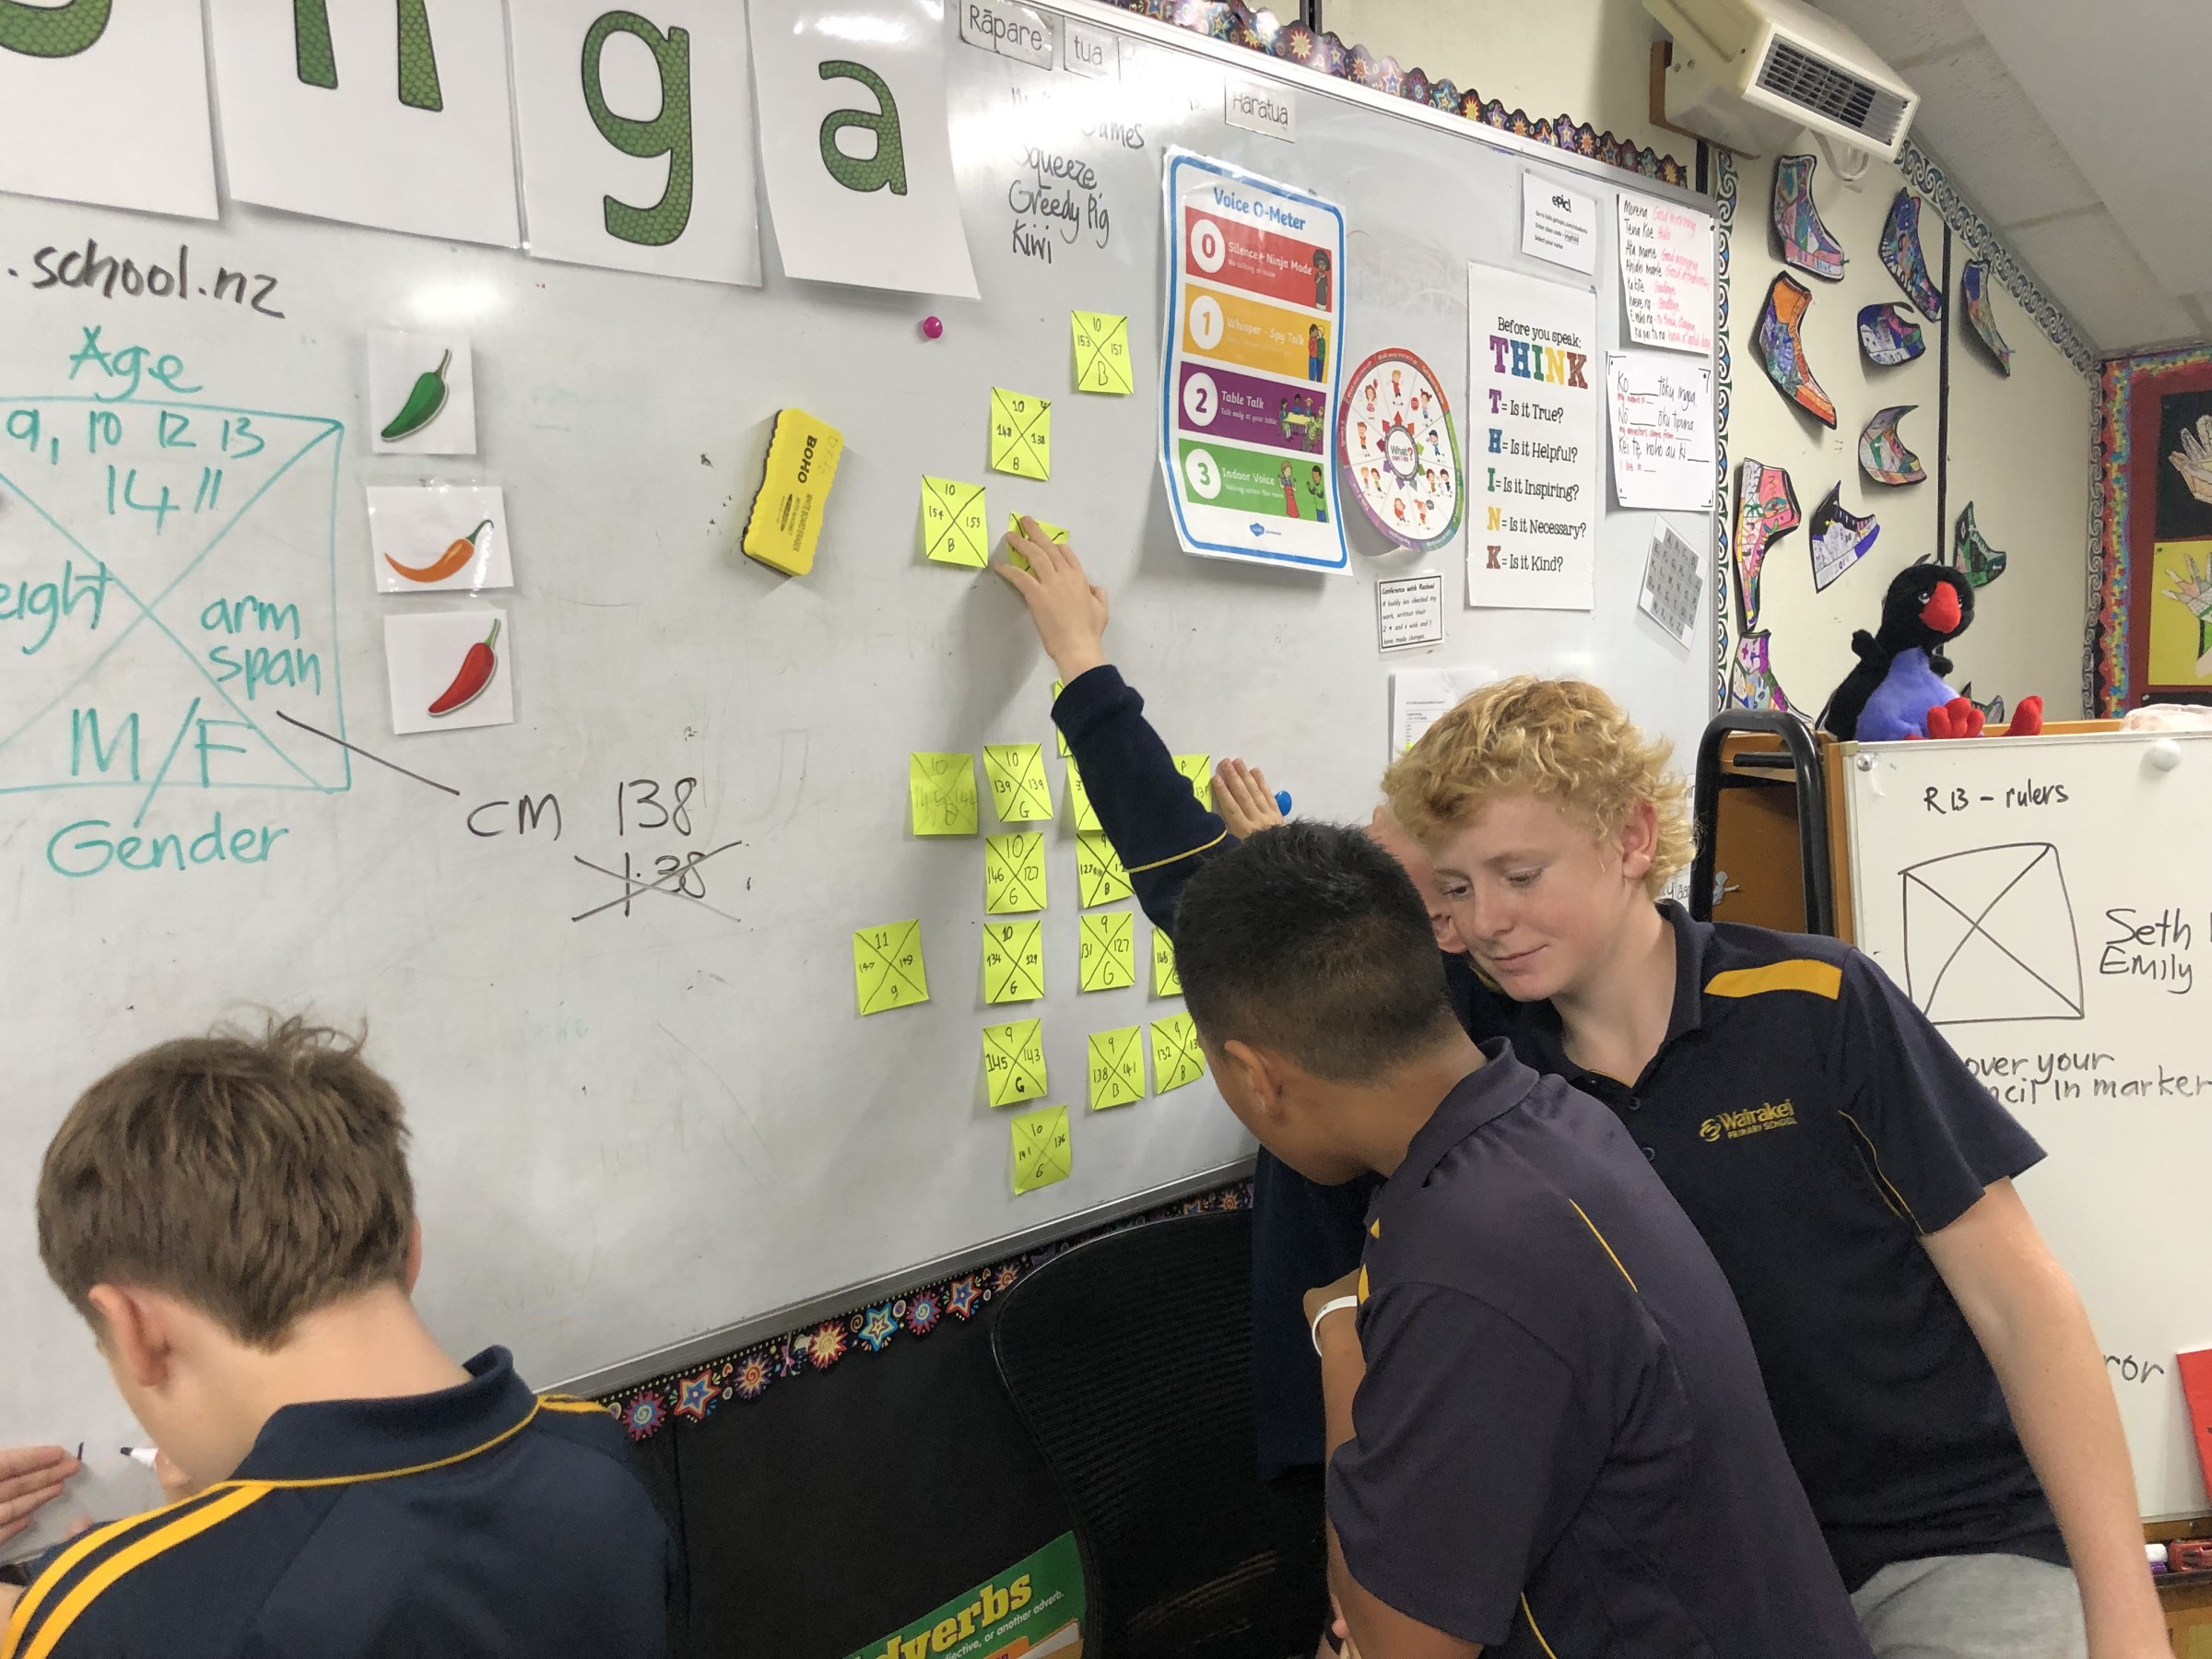
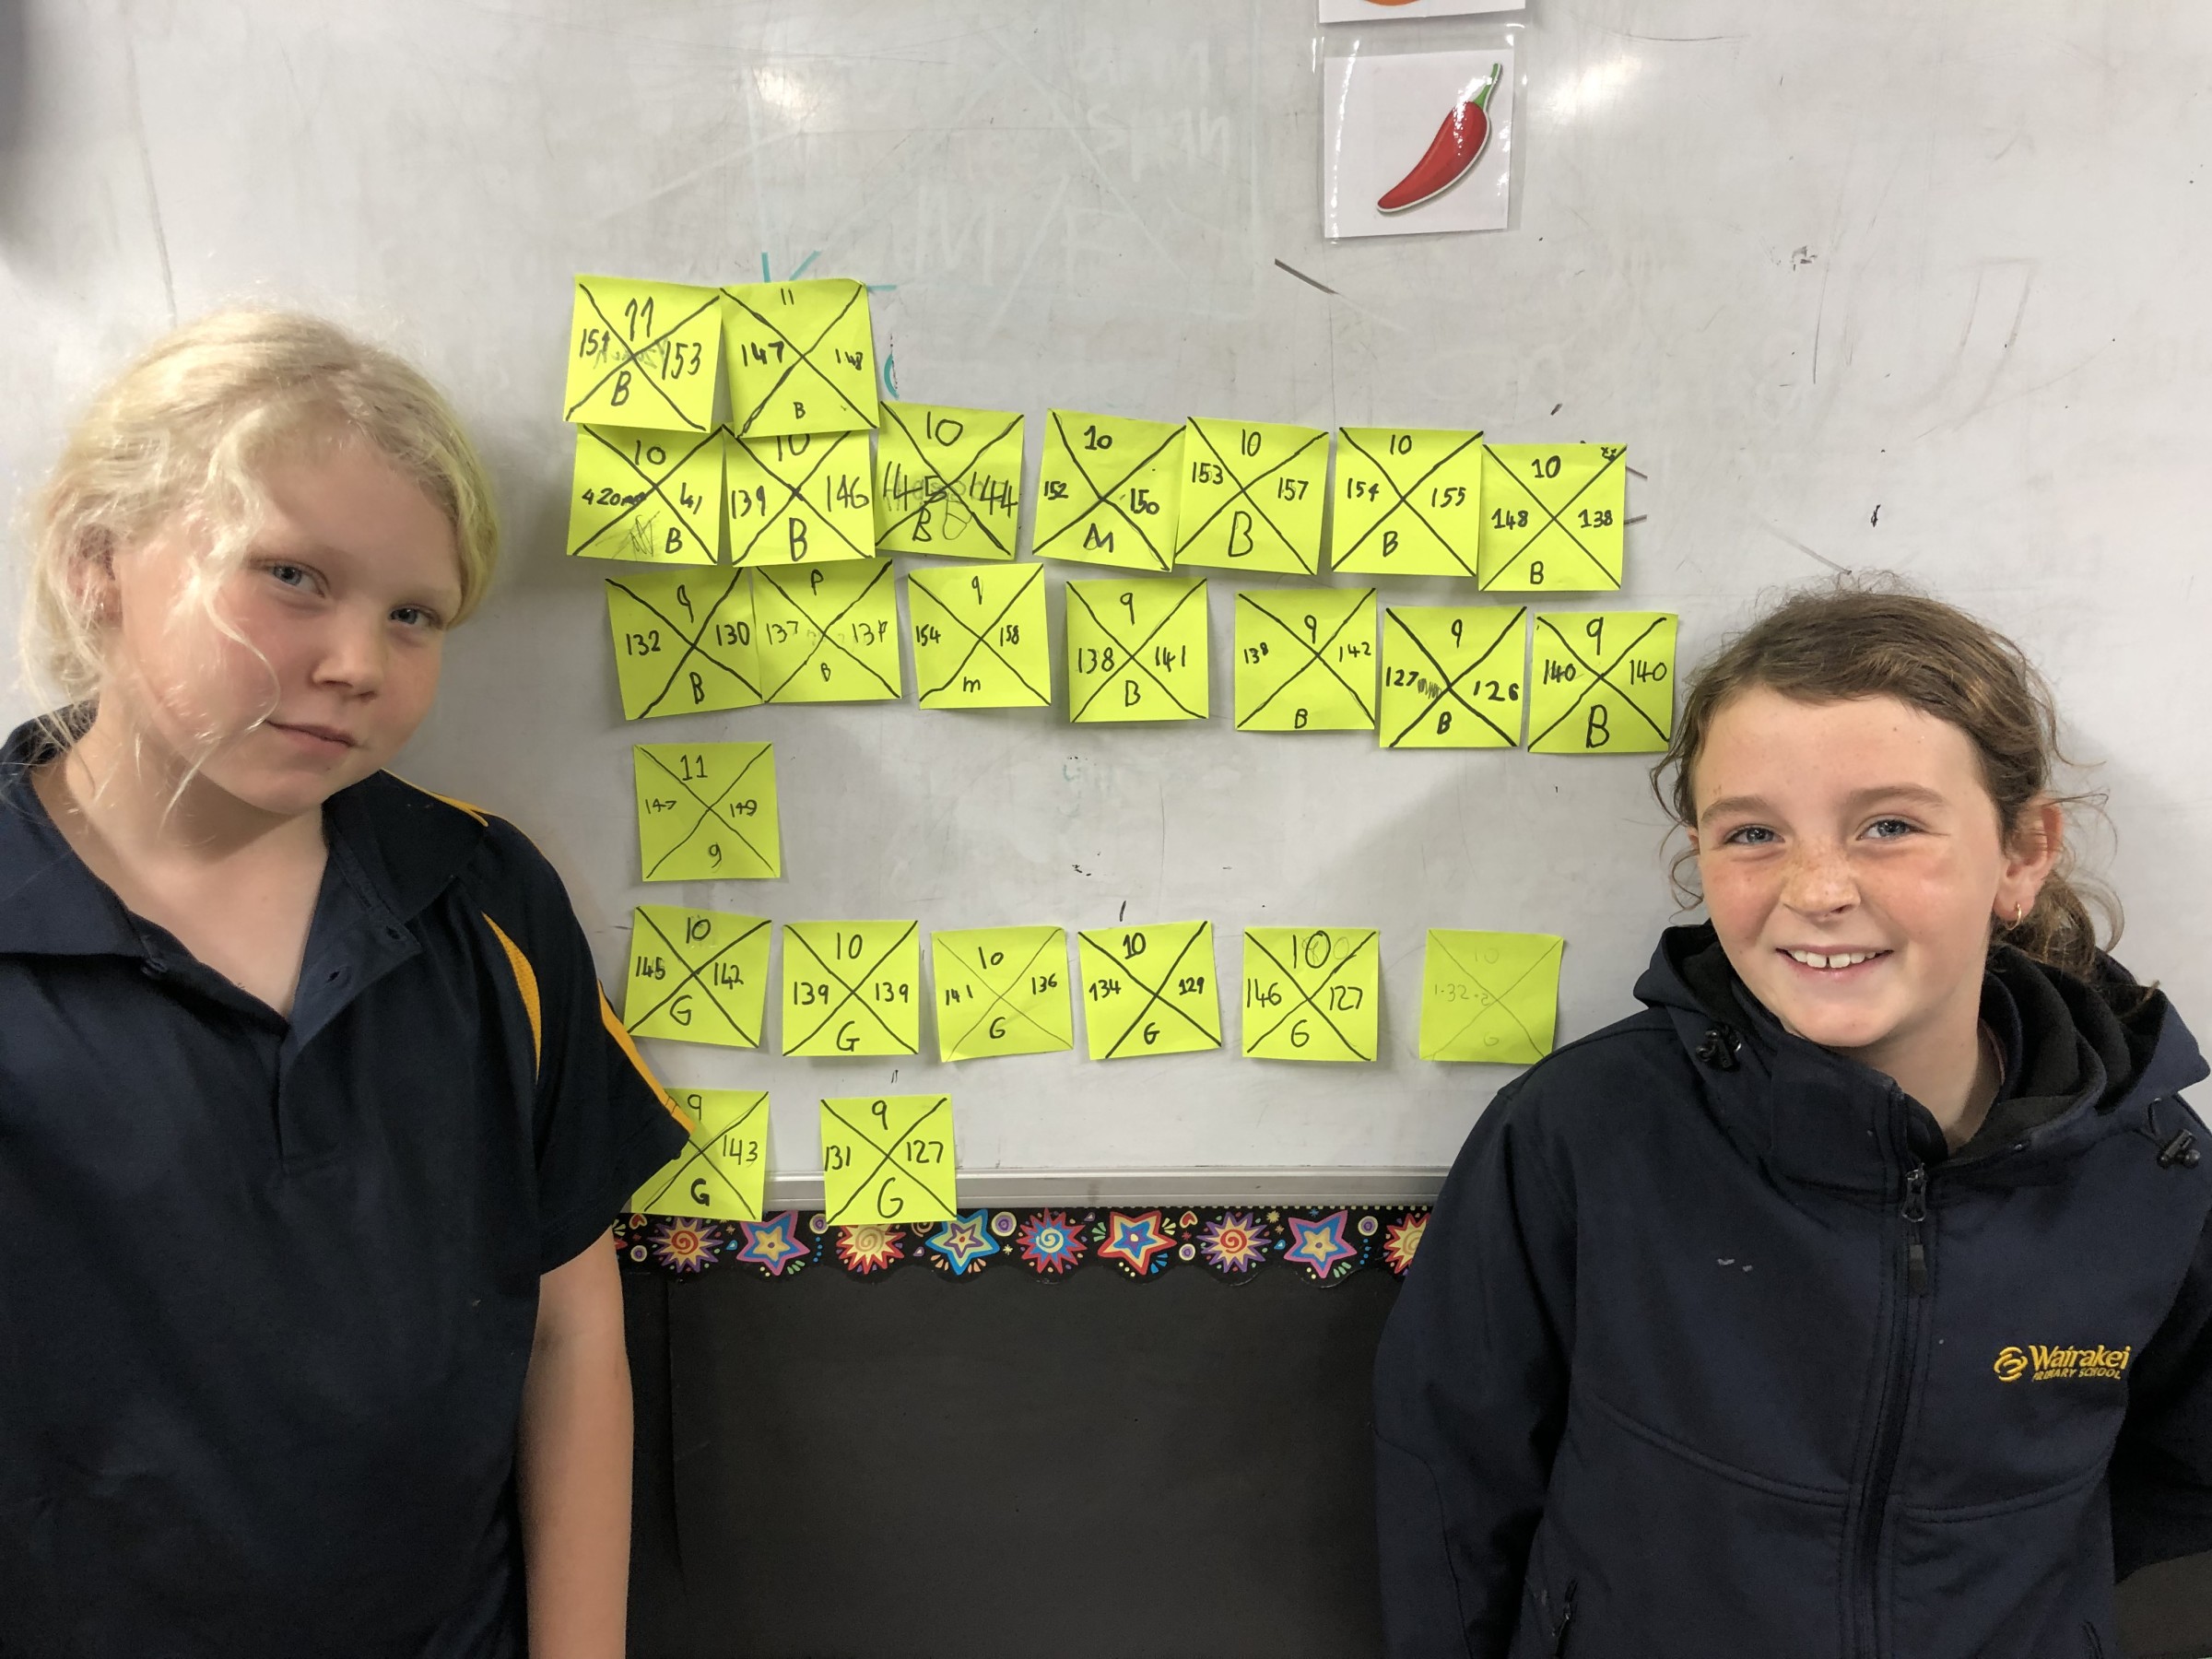
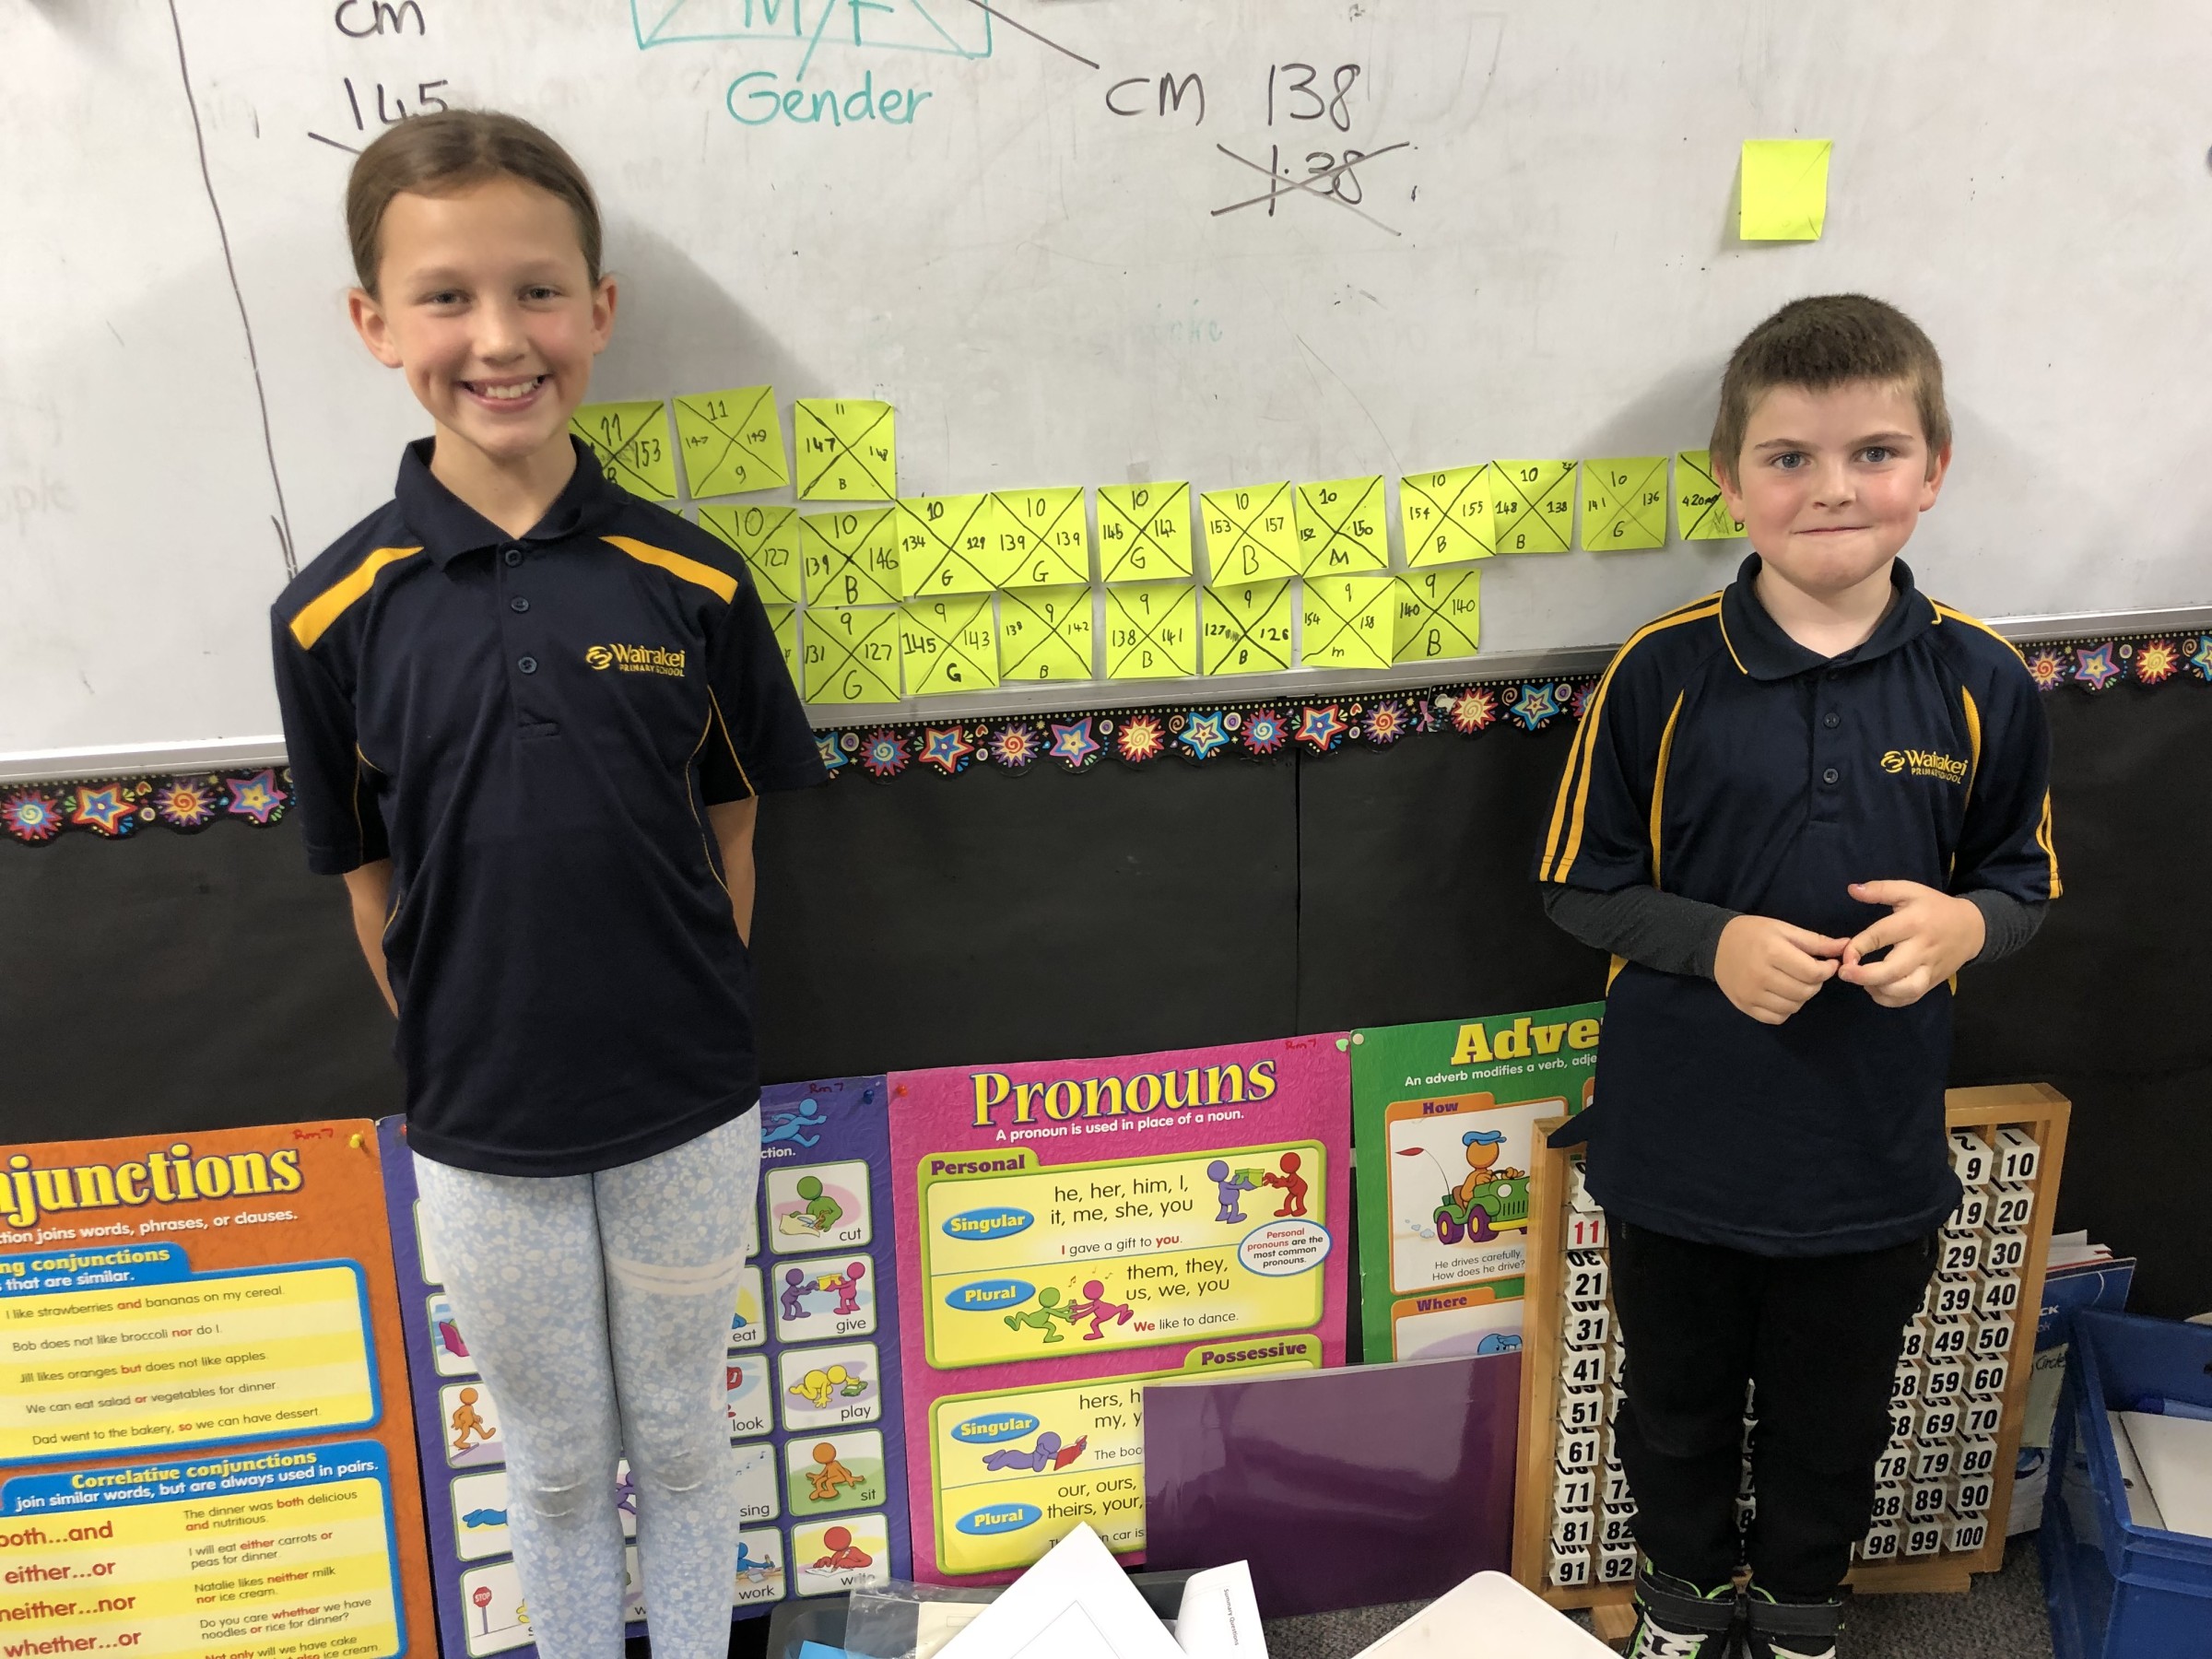
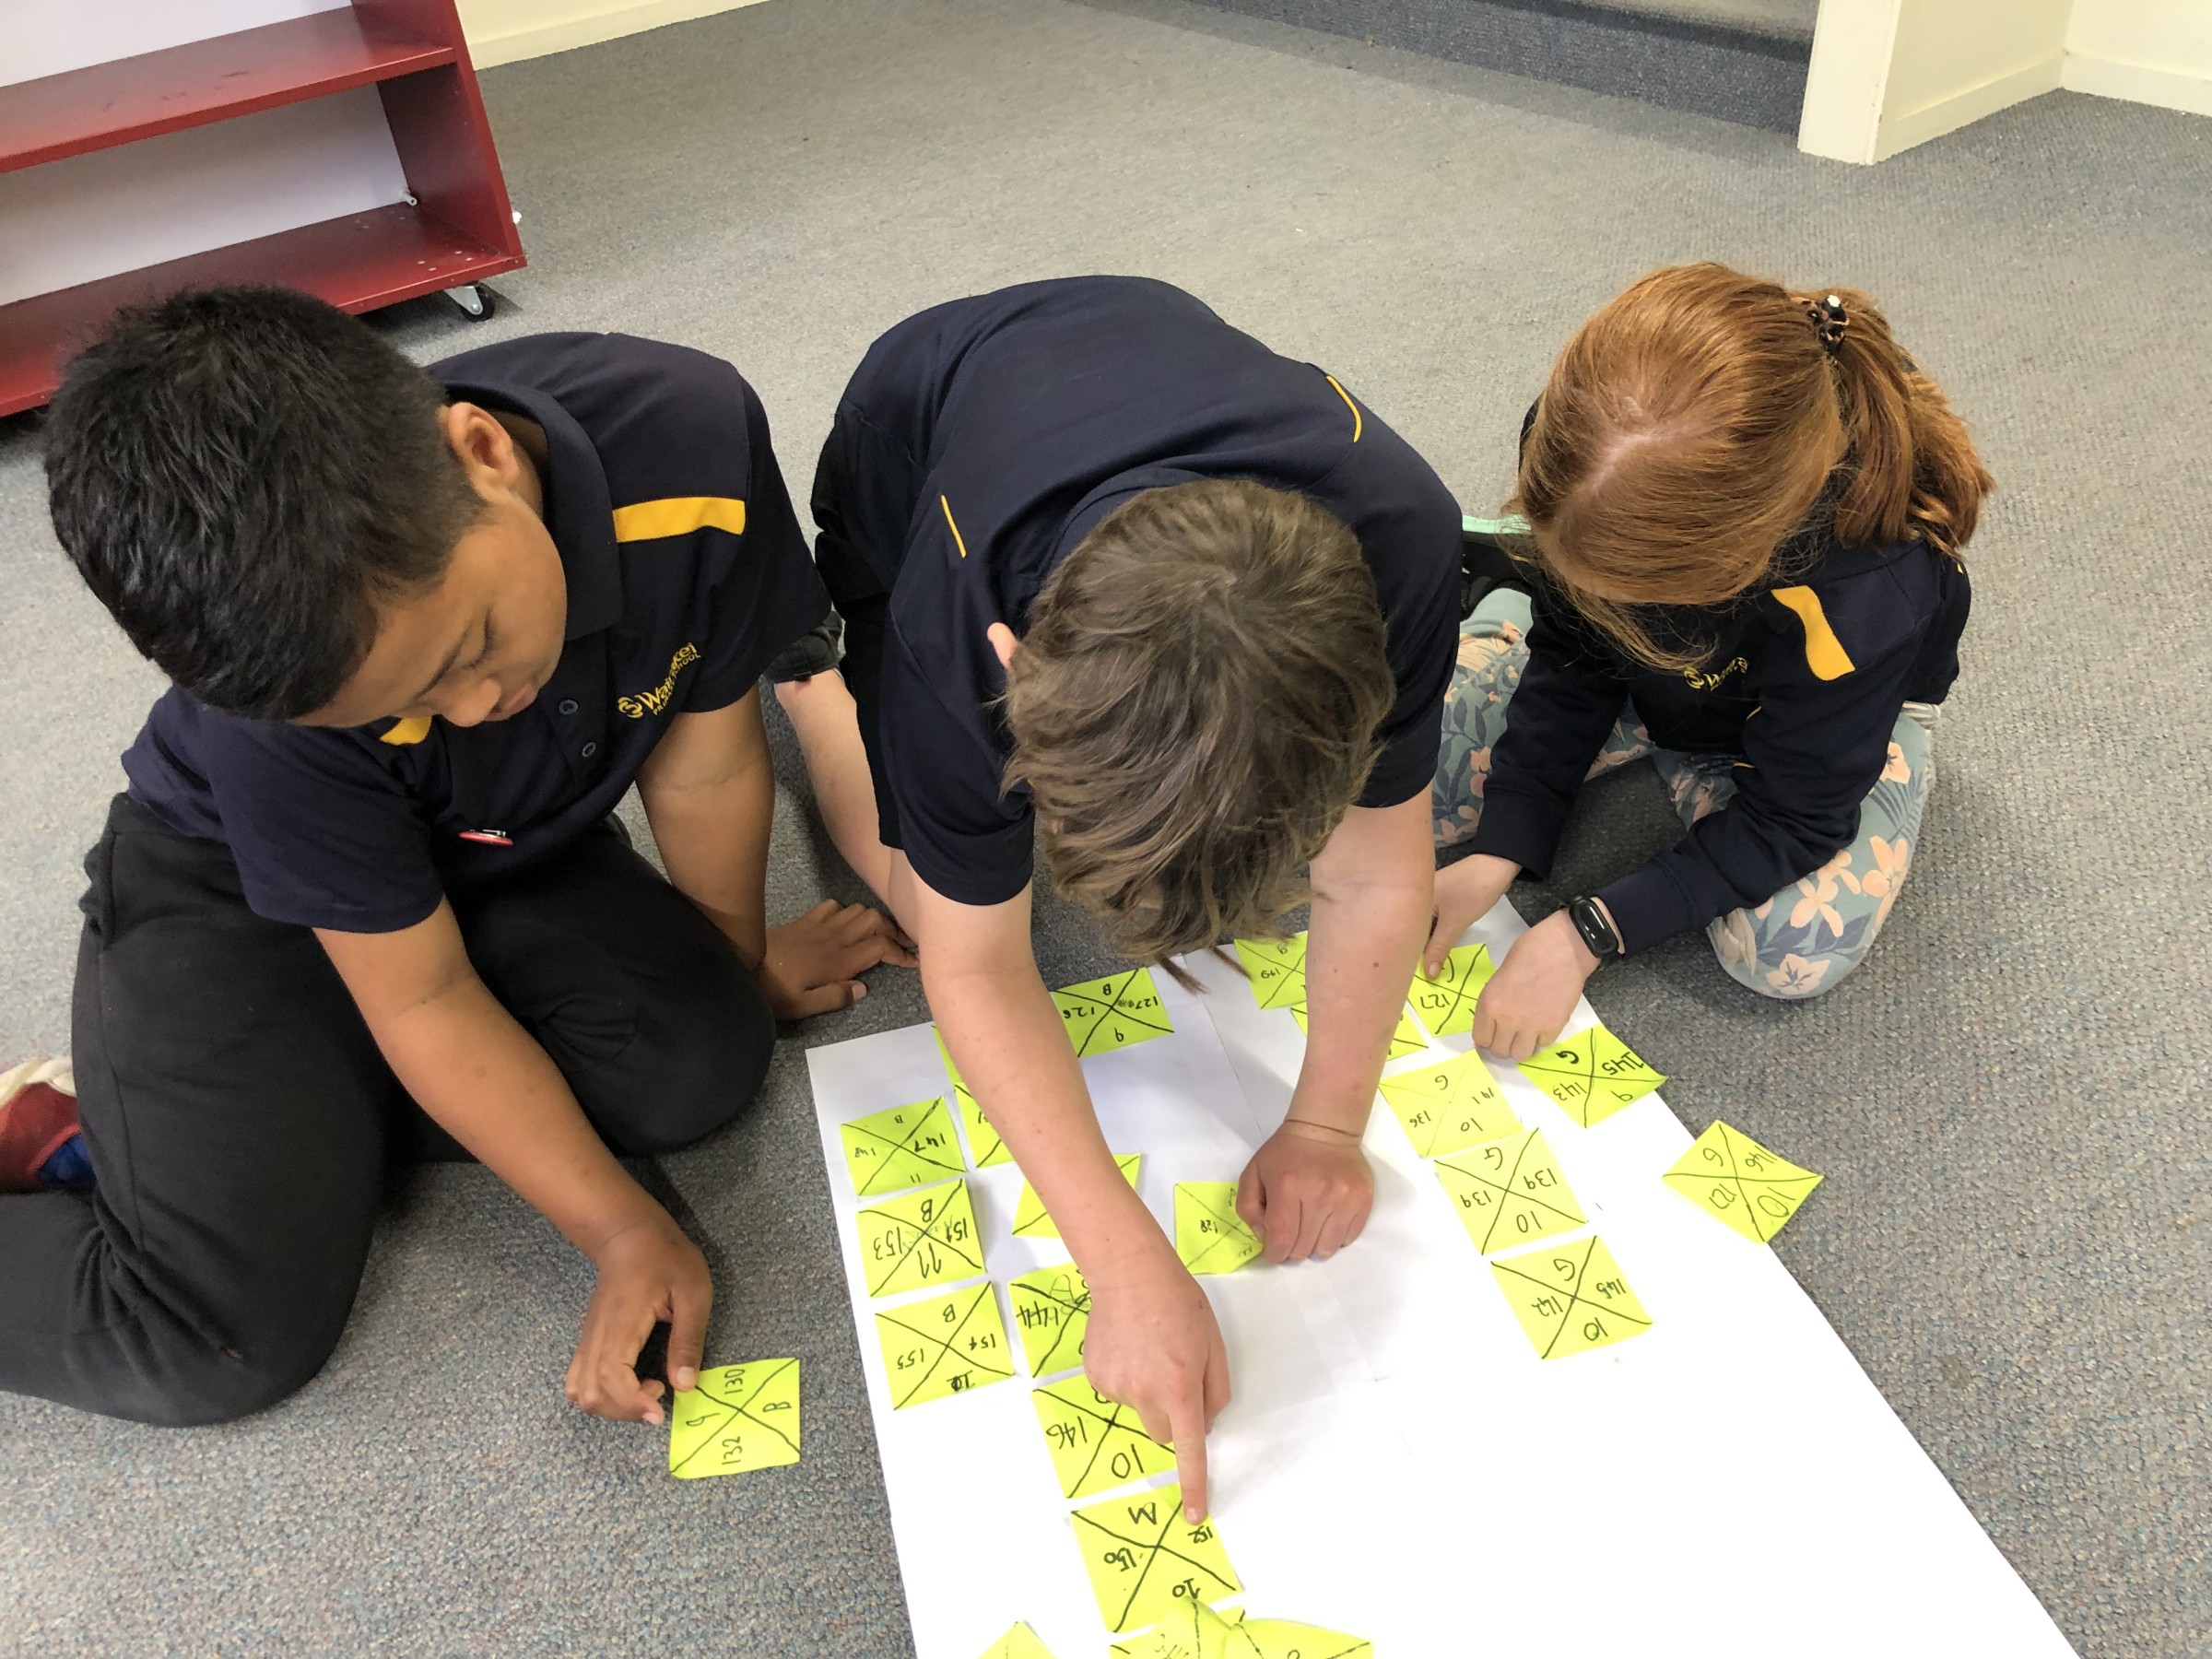
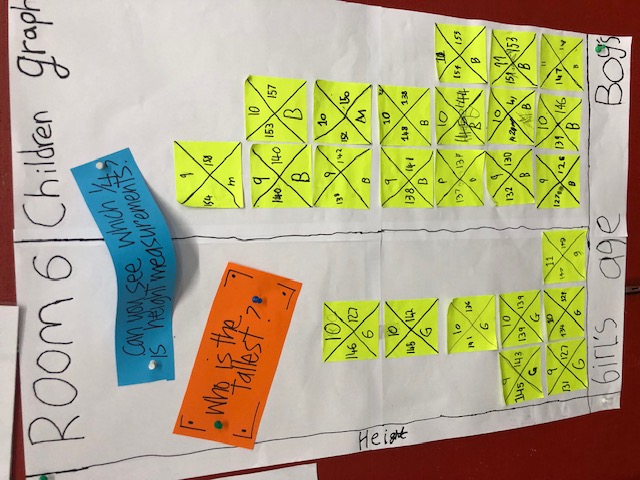
They recorded their height, arm span, age and gender on post it notes so the information could be moved around. This information was collected as part of the nationwide census that schools could opt into.
This task gave an authentic purpose to using statistics in the classroom and had students re assessing their own thinking and ideas about the relationships between data that involves at least 2 different factors such as noticing that boys tended to have longer arm spans than the girls.
There were suggestions that perhaps longer arm spans meant taller people. Students also noticed that while boys tended to be taller than girls this could not be stated for our whole class as we had one girl taller than all our boys. So the class decided we could not say one gender was taller but could say that most boys were taller. What does the data tell us and what statements can we make after reviewing the data. Practing making making statments was a key part of the learning process.
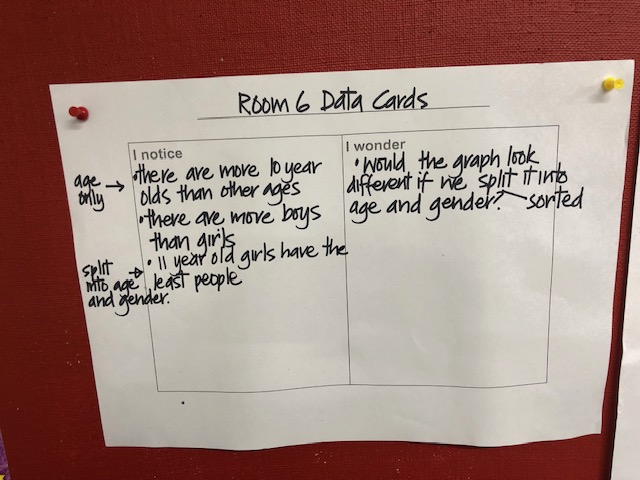
Together we noticed a number of things about our class and wondered whether our graph would look different if we sorted the data according to a different focus.
Comments
No one has commented on this post yet.