Using statistics to compare New Zealand to other countries has led to some fascinating discoveries. Each individual student investigation began with a question, followed by gathering and recording data, presenting findings, analysing information, and forming conclusions.
The questions for the investigations varied greatly, covering many different topics. Marshall wanted to compare the average number of lightning strikes in New Zealand to other countries, while Ava looked into the number of people who do gymnastics.
Kian found data on the number of mountain bike parks in different parts of the world, and Hazel investigated the number of schools in various countries.
Finding data using a Google search raised new challenges. Many questions had to be adjusted slightly to ensure the data was reliable. Heath wanted to compare the price of go-karts in different countries and then realised that currency conversions were necessary to make fair comparisons. After converting prices into New Zealand Dollars, he discovered that new go-karts were much more expensive in the UK and Spain than in New Zealand.
Max started with a question about the number of colours on national flags. The data was easy to find but not particularly meaningful, as most flags contained three or four colours. He then shifted his focus to the number of cats in different countries. The numbers varied widely, but he realised that population size affected the totals. By shifting the focus again to find data on the percentage of households who have pets, Max discovered that New Zealand had the highest percentage compared to the other countries in his investigation.
New Zealand has 40.5% of households with pet cats, which means that it actually would be in the lead if it had the population size of America.
Tane wanted to find out how many kids in New Zealand play rugby. He gathered data from 11 other countries and found that the USA has the highest number of registered rugby players, followed by South Africa. Realising that population size played a role, he decided to look at the percentage of kids who play rugby instead. After further research, he discovered that New Zealand had the highest percentage of children registered for rugby, followed by the UK and Uruguay.
New Zealand has the highest percentage of kids who play rugby because it is our national sport
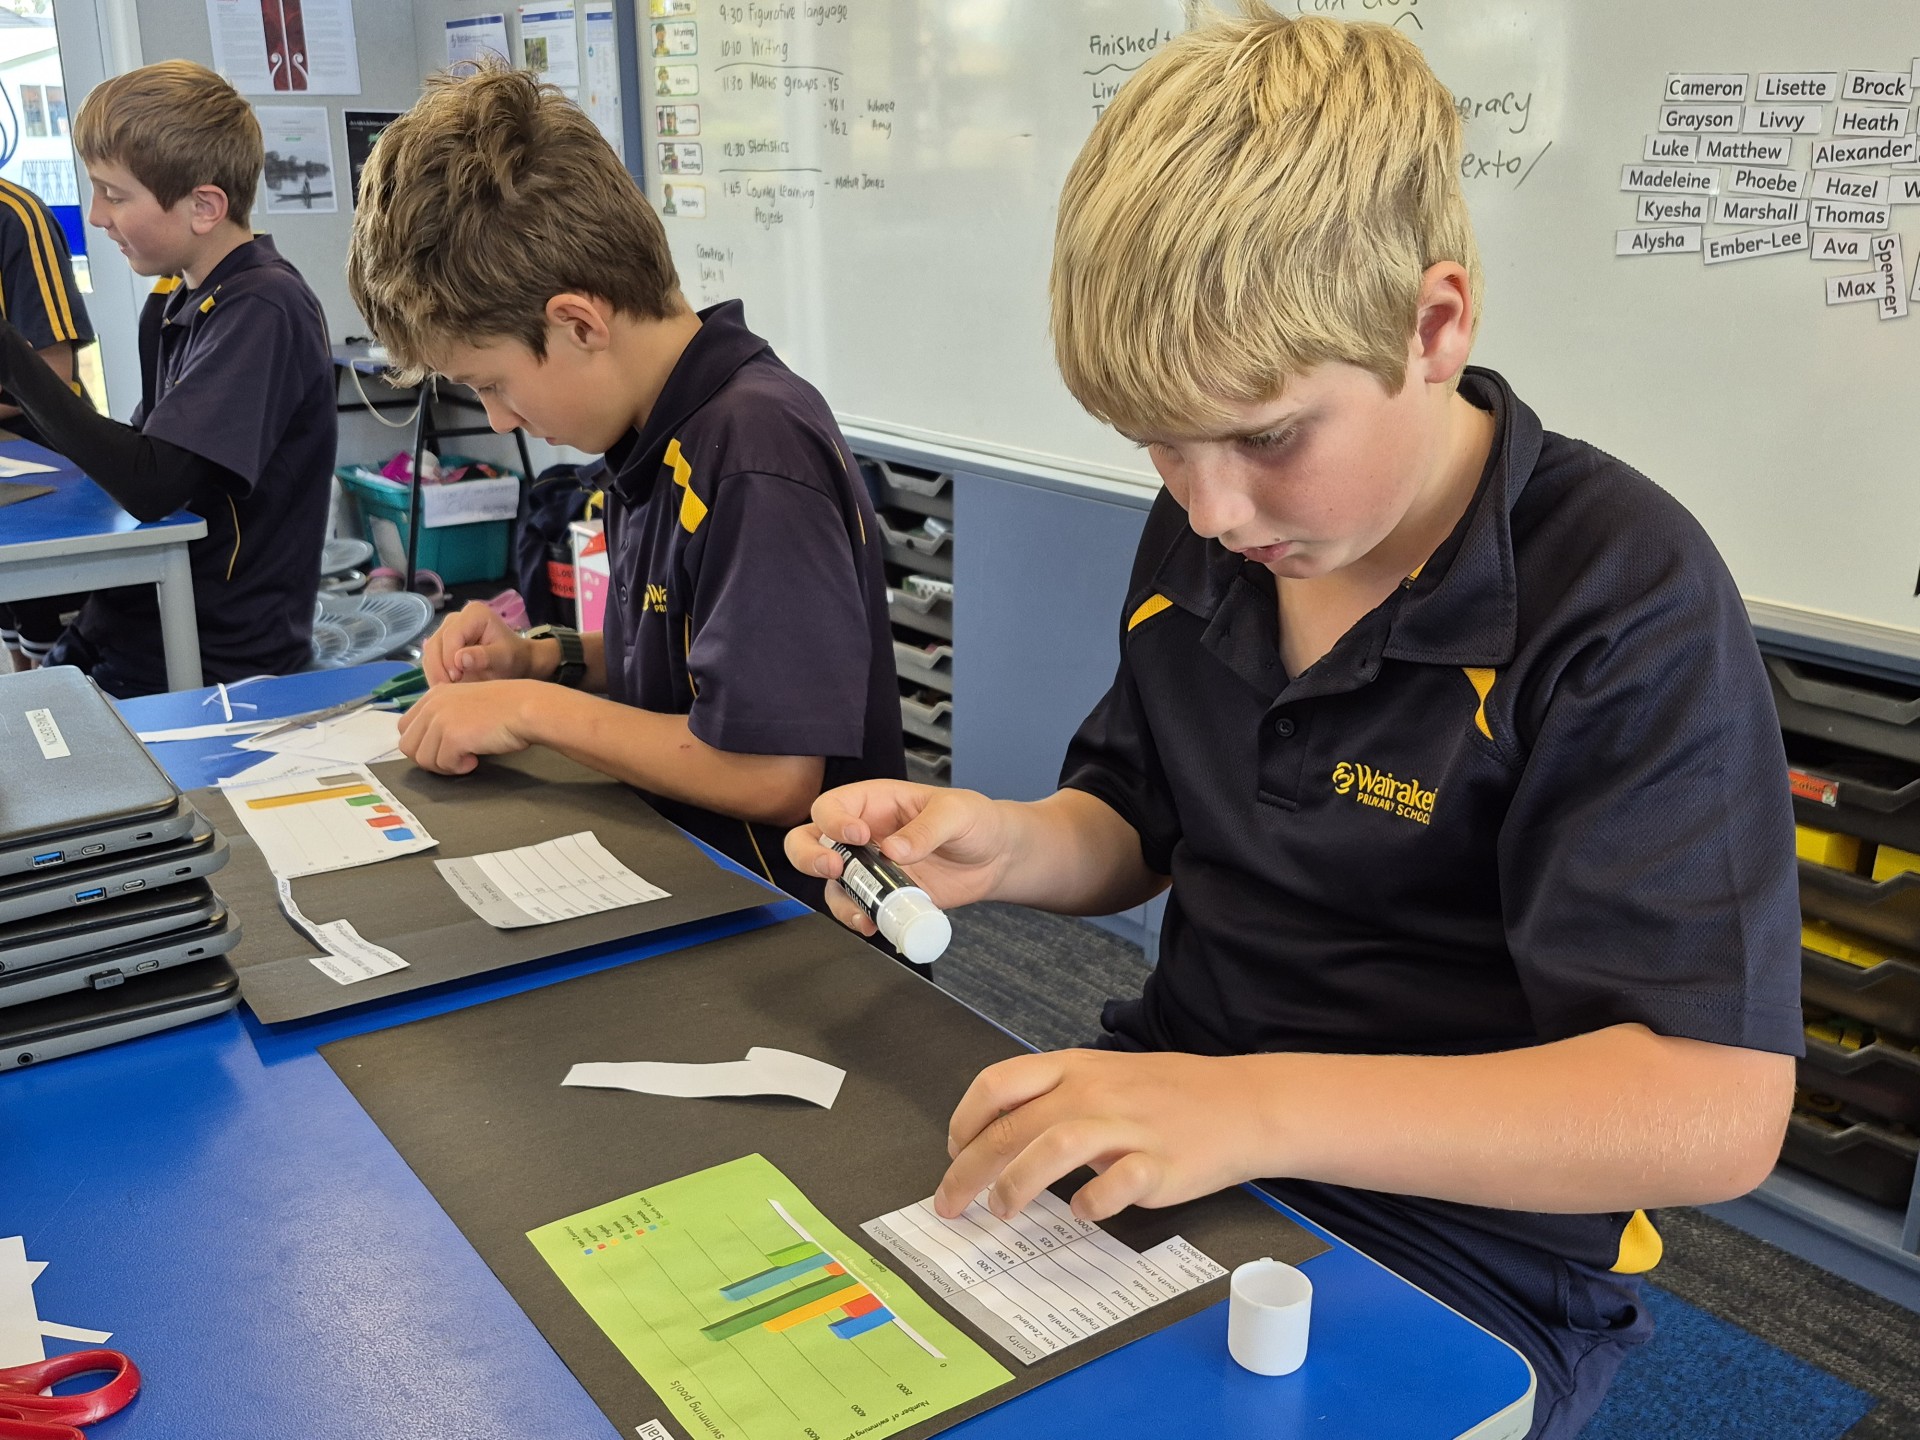
Creating bar charts using Google Sheets provided a visual representation of the data, while customising graphs was a fun exercise. Livvy had a great time turning her chart about the number of tropical storms in various countries rainbow coloured. Matthew made his graph on the number of babies born every year red, and Grayson made his one about swimming pools green.
Analysing to look for patterns and trends, and then forming conclusions, allowed for deeper thinking about the reasons behind the data.
New Zealand is on a fault line, which might be why it has more earthquakes than the other countries. I thought that Australia would have more earthquakes because it is close to New Zealand, but the faultline doesn’t go through there at all.
Maybe Spain has more swimming pools than the other countries because it is very hot there, and people want to swim more.
Smaller countries have more cyclones because they’re on a coast line, and some of the big countries are not on a coast line, so that might be why they have no cyclones
I thought that Australia would have the most water usage per day because it is hotter over there, but it only had a little bit more than New Zealand. Maybe it is because it is dryer, so they have less water that they can use.
What began as a simple question led to a deeper understanding of statistics and how numbers can tell a story.


Comments
No one has commented on this post yet.