These were the questions the students of Room 7 needed to know the answers to!
To find these answers, students took part in a statistical investigation using the PPDAC cycle. What is a PPDAC cycle?
It is a way of collecting and using data by following 5 steps.
1. The problem section is about formulating a statistical question, what data to collect, who to collect it from and why it is important.
Students had to decide on what questions they were going to ask. They had to think carefully about what questions were going to give us the answers we want.
One question suggested was: Are you the oldest child? As a group, it was decided that it needed to be an open ended question to get more results than yes or no.
There was lots of discussion and debating until the final four questions were decided.
- What is your favourite animal?
- What is the main sport you play?
- What is your favourite colour?
- How old are you?
2. The plan section is about how the data will be gathered.
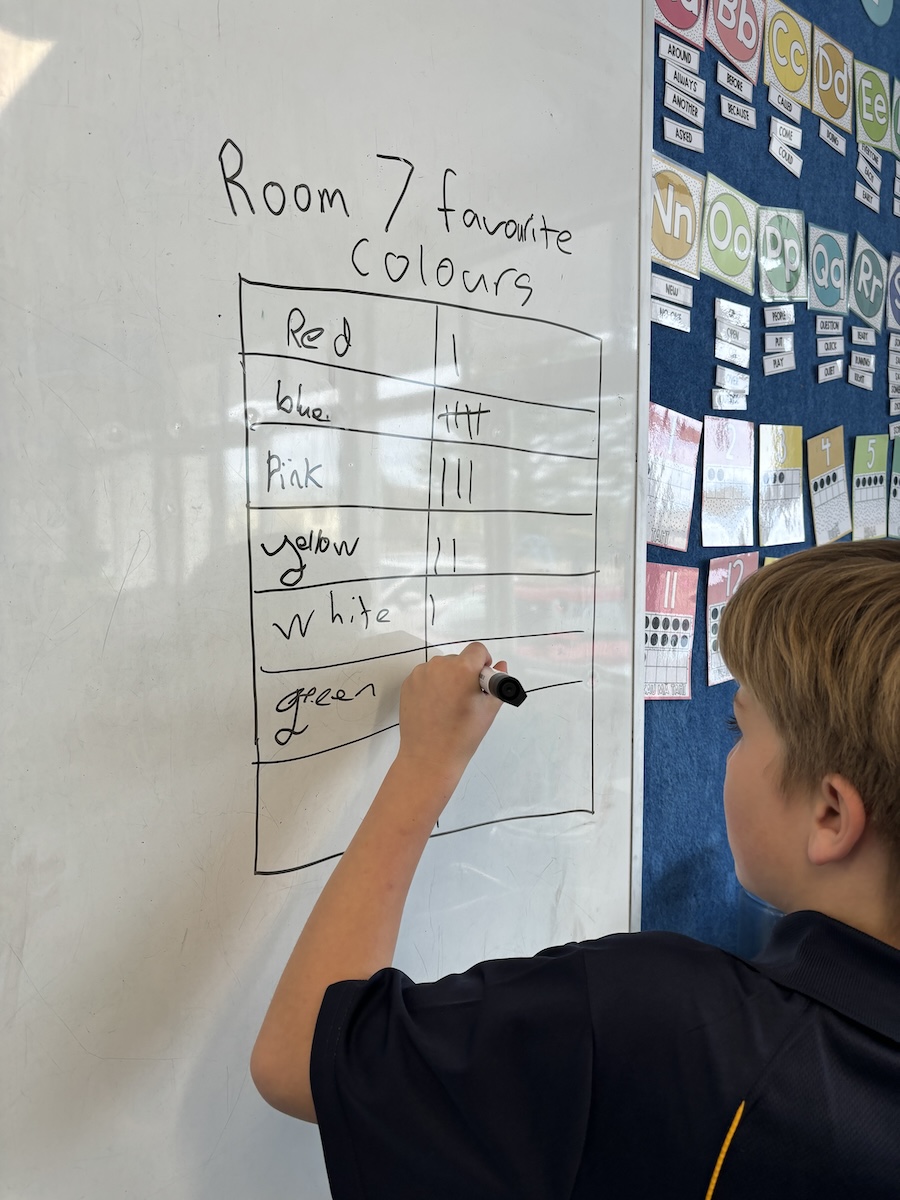
This part is important to work out the best option for collecting data. How are we going to record what we find out? The final decision was to use a tally chart so it was easy and quick to collect the data.
3. The data section is about how the data is managed and organised.
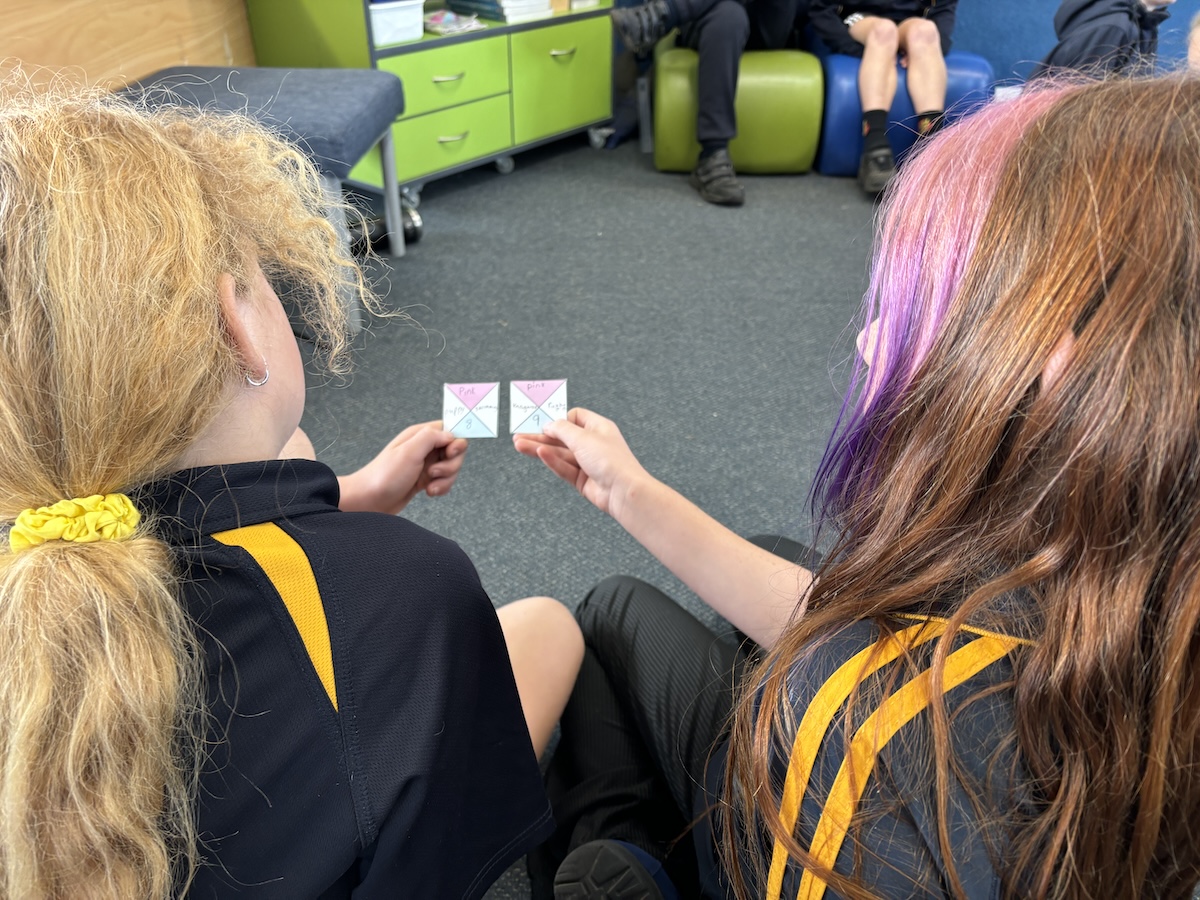
This part is where students began to collect the data in their books. They had to create a tally to add the options and marks to as other students gave their answers.
As we were doing this, Austin noticed something interesting when someone was recording their data.
You added red at the bottom (of the tally chart), but you forgot to add a tally mark!
- The analysis section is about exploring and analysing the data, using a variety of data displays and numerical summaries, and reasoning with the data.
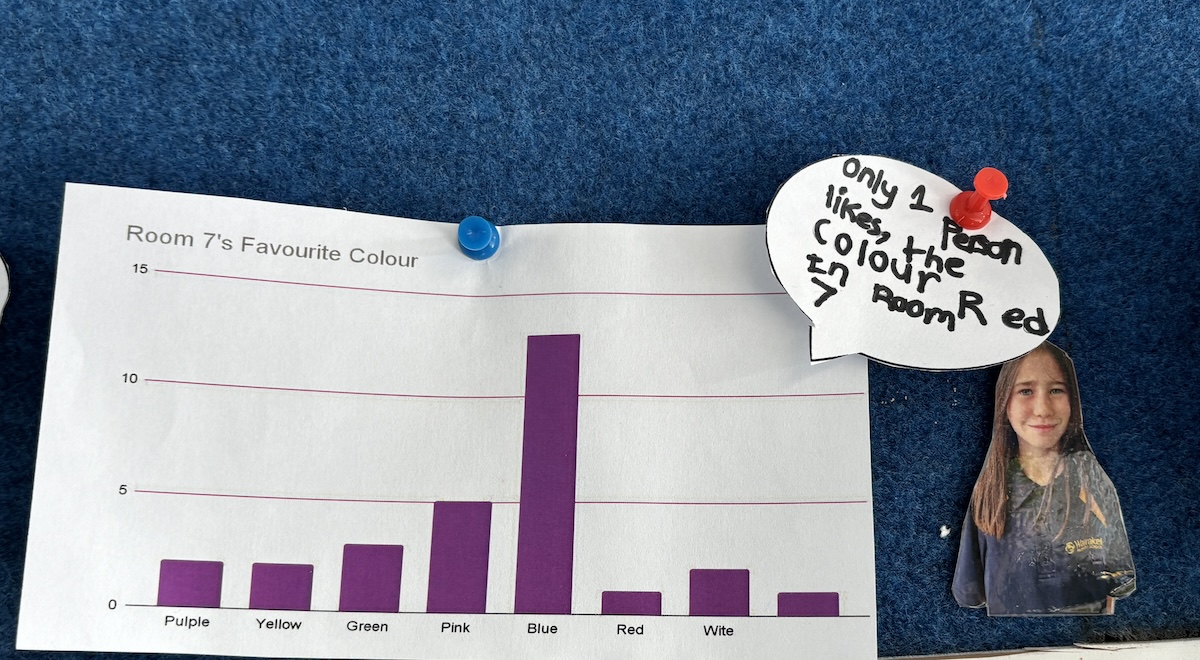
This is where the tamariki had to take all the data that they had collected and use Google Sheets to add their information and turn it into a graph.
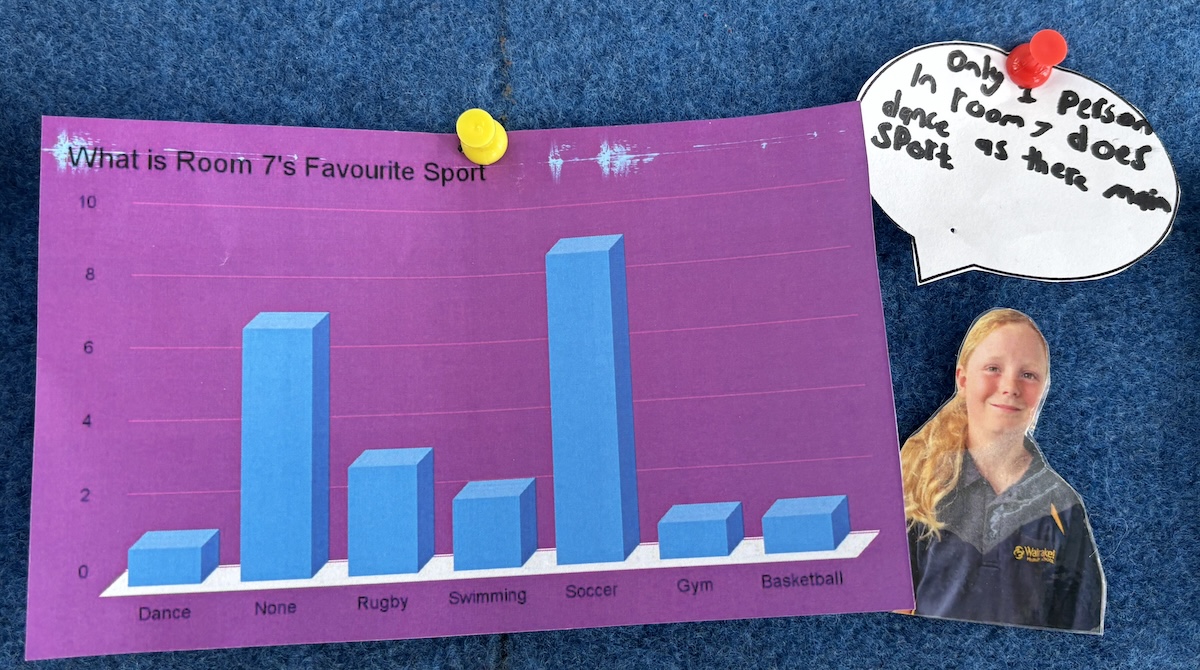
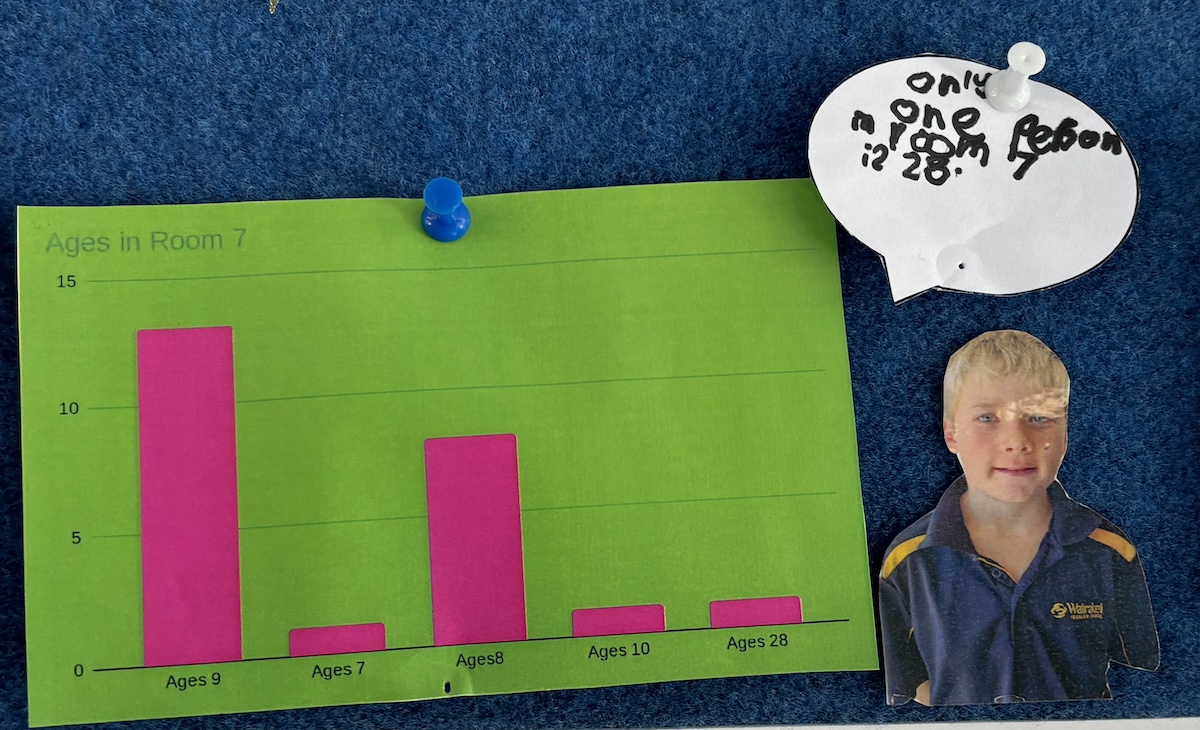
The conclusion section is about answering the question in the problem section and giving reasons based on the analysis section.
I learned how to read a graph properly. I didn't know how to work out the amounts on bar graphs before. Indie
I learned how to compare things by reading information on a bar graph
Only one person in our class like black as their favourite colour
Comments are disabled for this post.