
When working together on problem-solving situations, questions that involve measurements and calculations provoke the most debate and challenge students' thinking. These types of questions require students to be precise and check their thinking. Sometimes a visual diagram is needed. What if their diagrams lack accuracy, or what if students won't change their thinking?
The following question proved to be challenging:
A 20-metre x 20-metre square field has trees planted every 2 metres along its border. How many trees are there?
Benjamin and Kian were adamant: “The answer is 36 trees because you can’t plant a tree on top of a tree.”
Other students came up with similar answers to Benjamin and Kian. Aria thought there would be 37 trees, and Max S found 41 trees. These incorrect answers came from a lack of precision – inaccurate counting or measuring.
Another question about a chessboard also sparked debate:
If I drew a straight line through an eight-by-eight chessboard, what is the largest number of squares it could pass through?
“It’s 16,” said Luke. “No, it’s 14,” argued Max. “I think it’s eight?” questioned Frankie.
My telling the student that their answers to these questions were incorrect was not working. They didn’t believe me and, to be honest, were much better at arguing than I was. A way to challenge students' thinking about their answers was needed.
Asking Mrs Farquhar if we could dig up the school field and plant trees every 2 metres along a 20-metre by 20-metre square was not appropriate, and I did not have an actual chessboard handy.
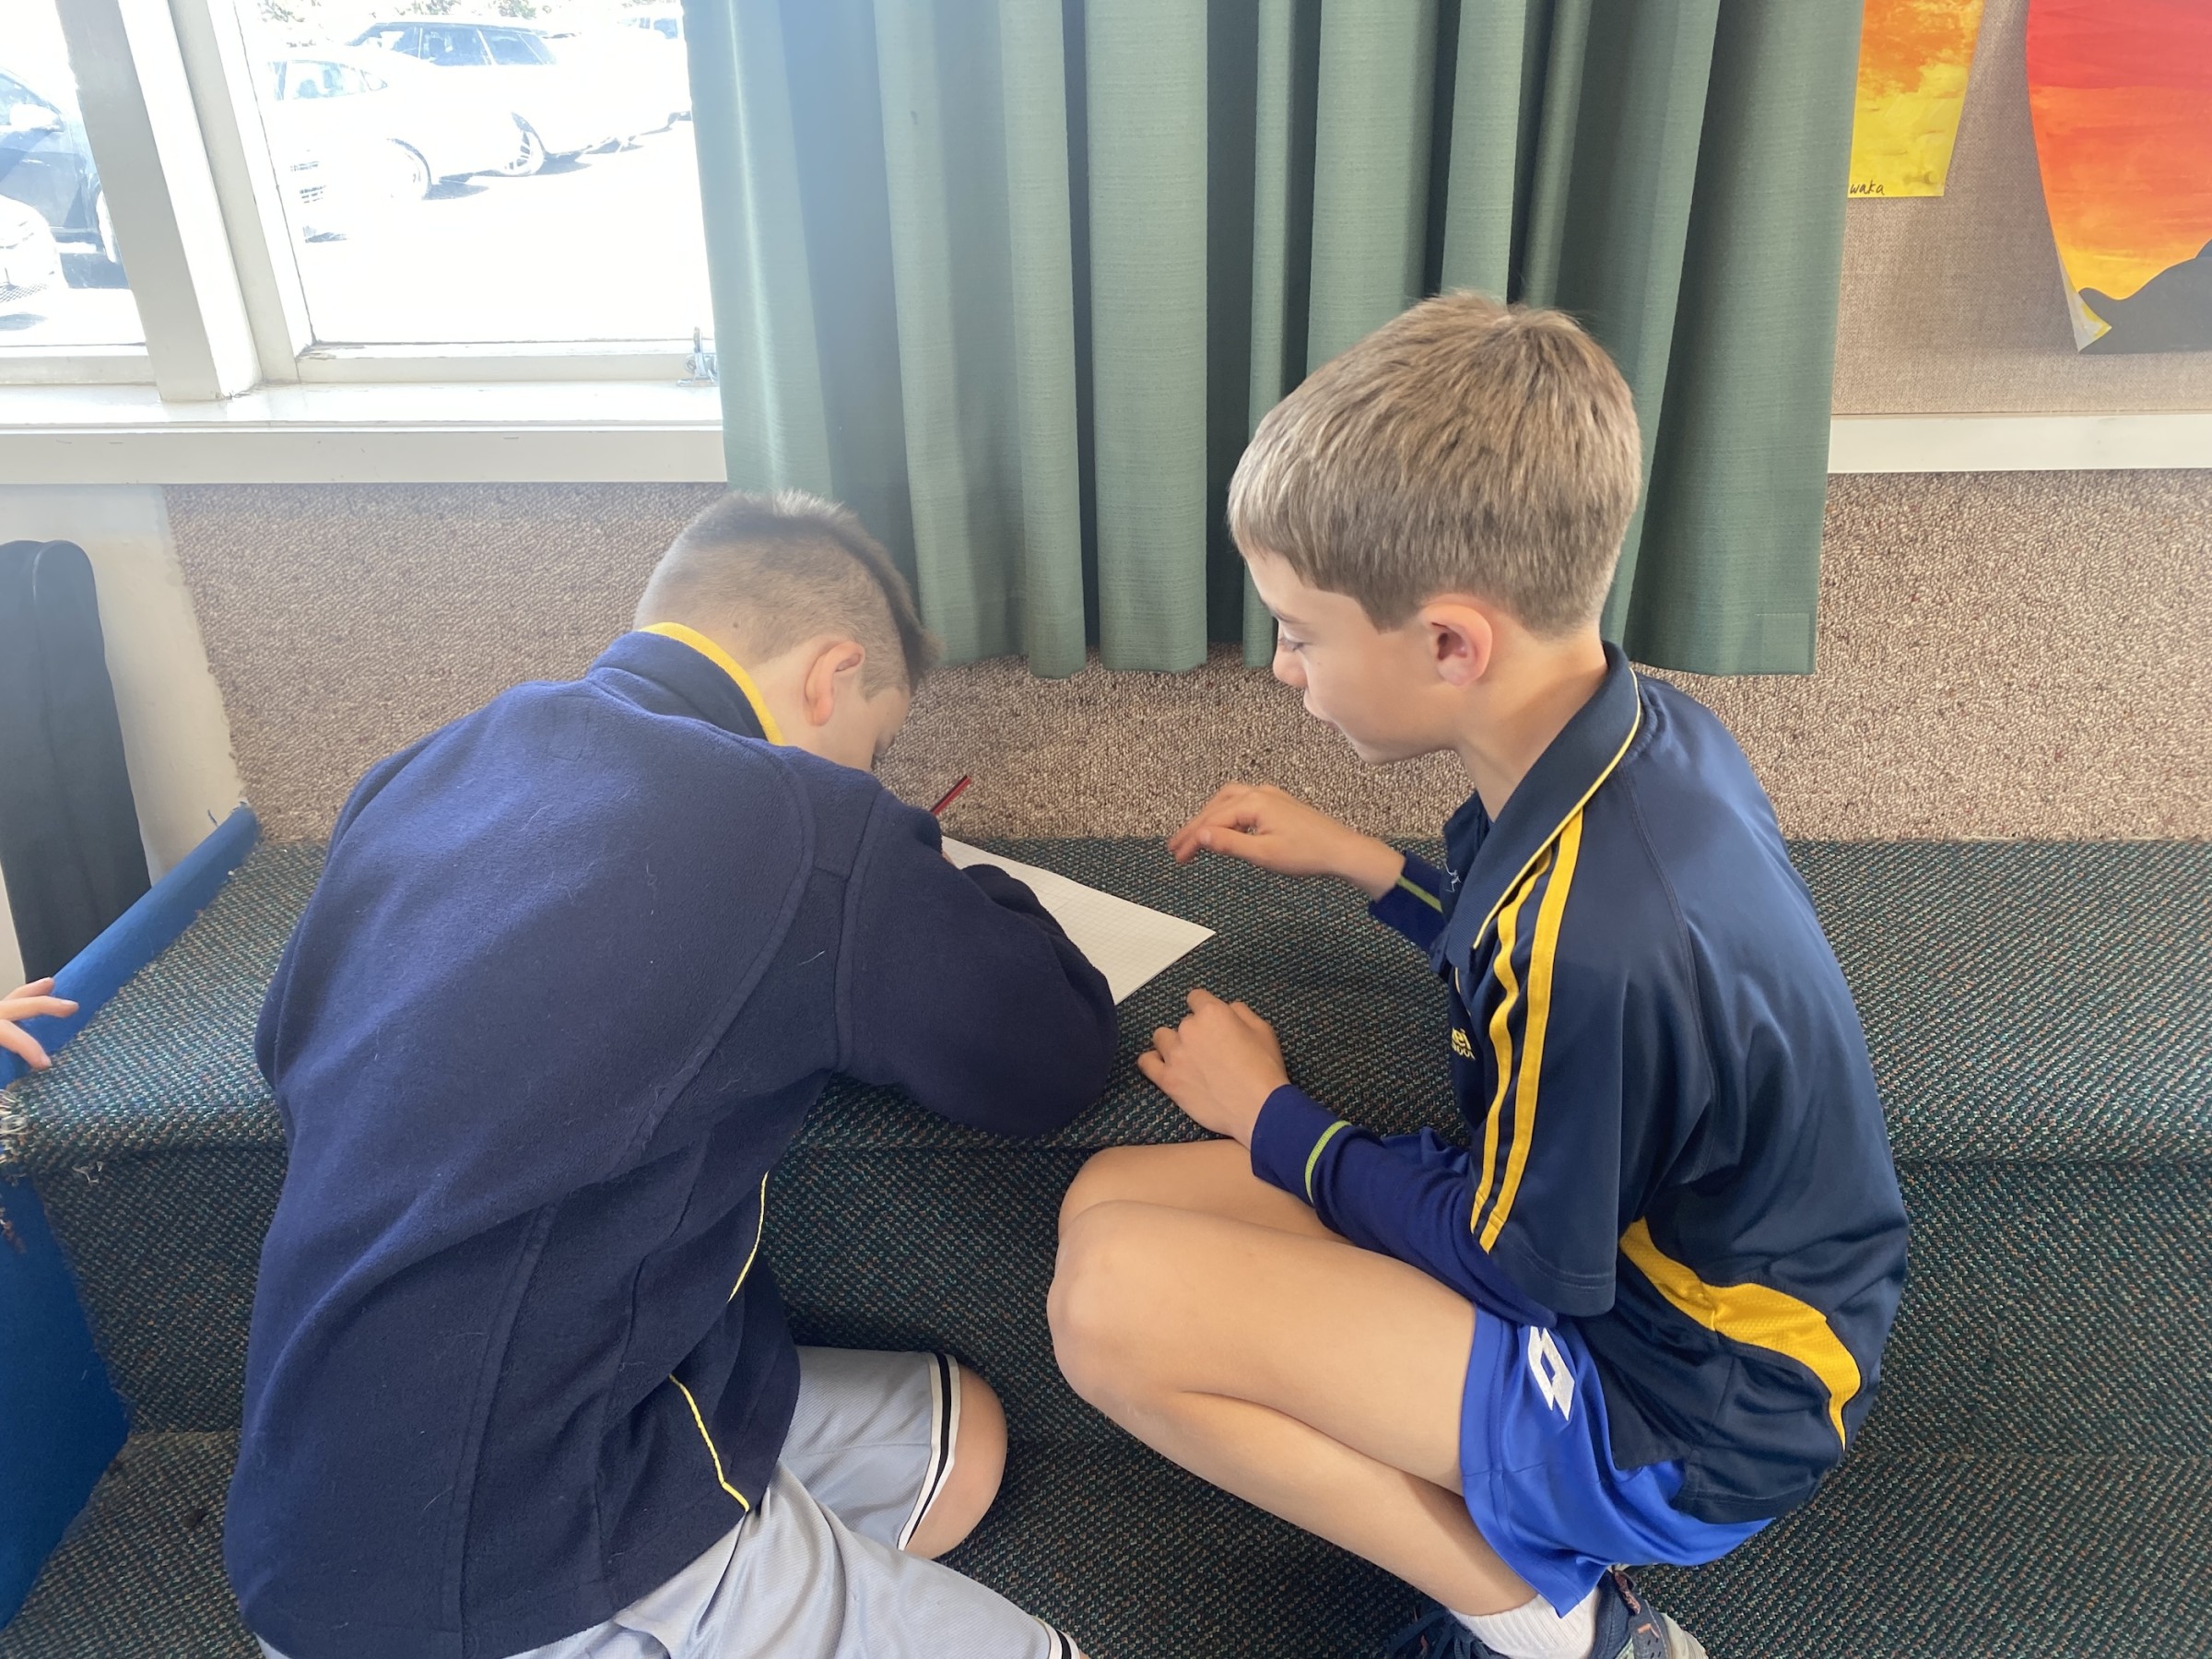
While on a recent Learner First Mathematics Professional Development course, I learnt about the power of grid paper as an enabler for student problem-solving situations.
Grid paper allows students to create accurate diagrams, particularly of measurement problem-solving situations.
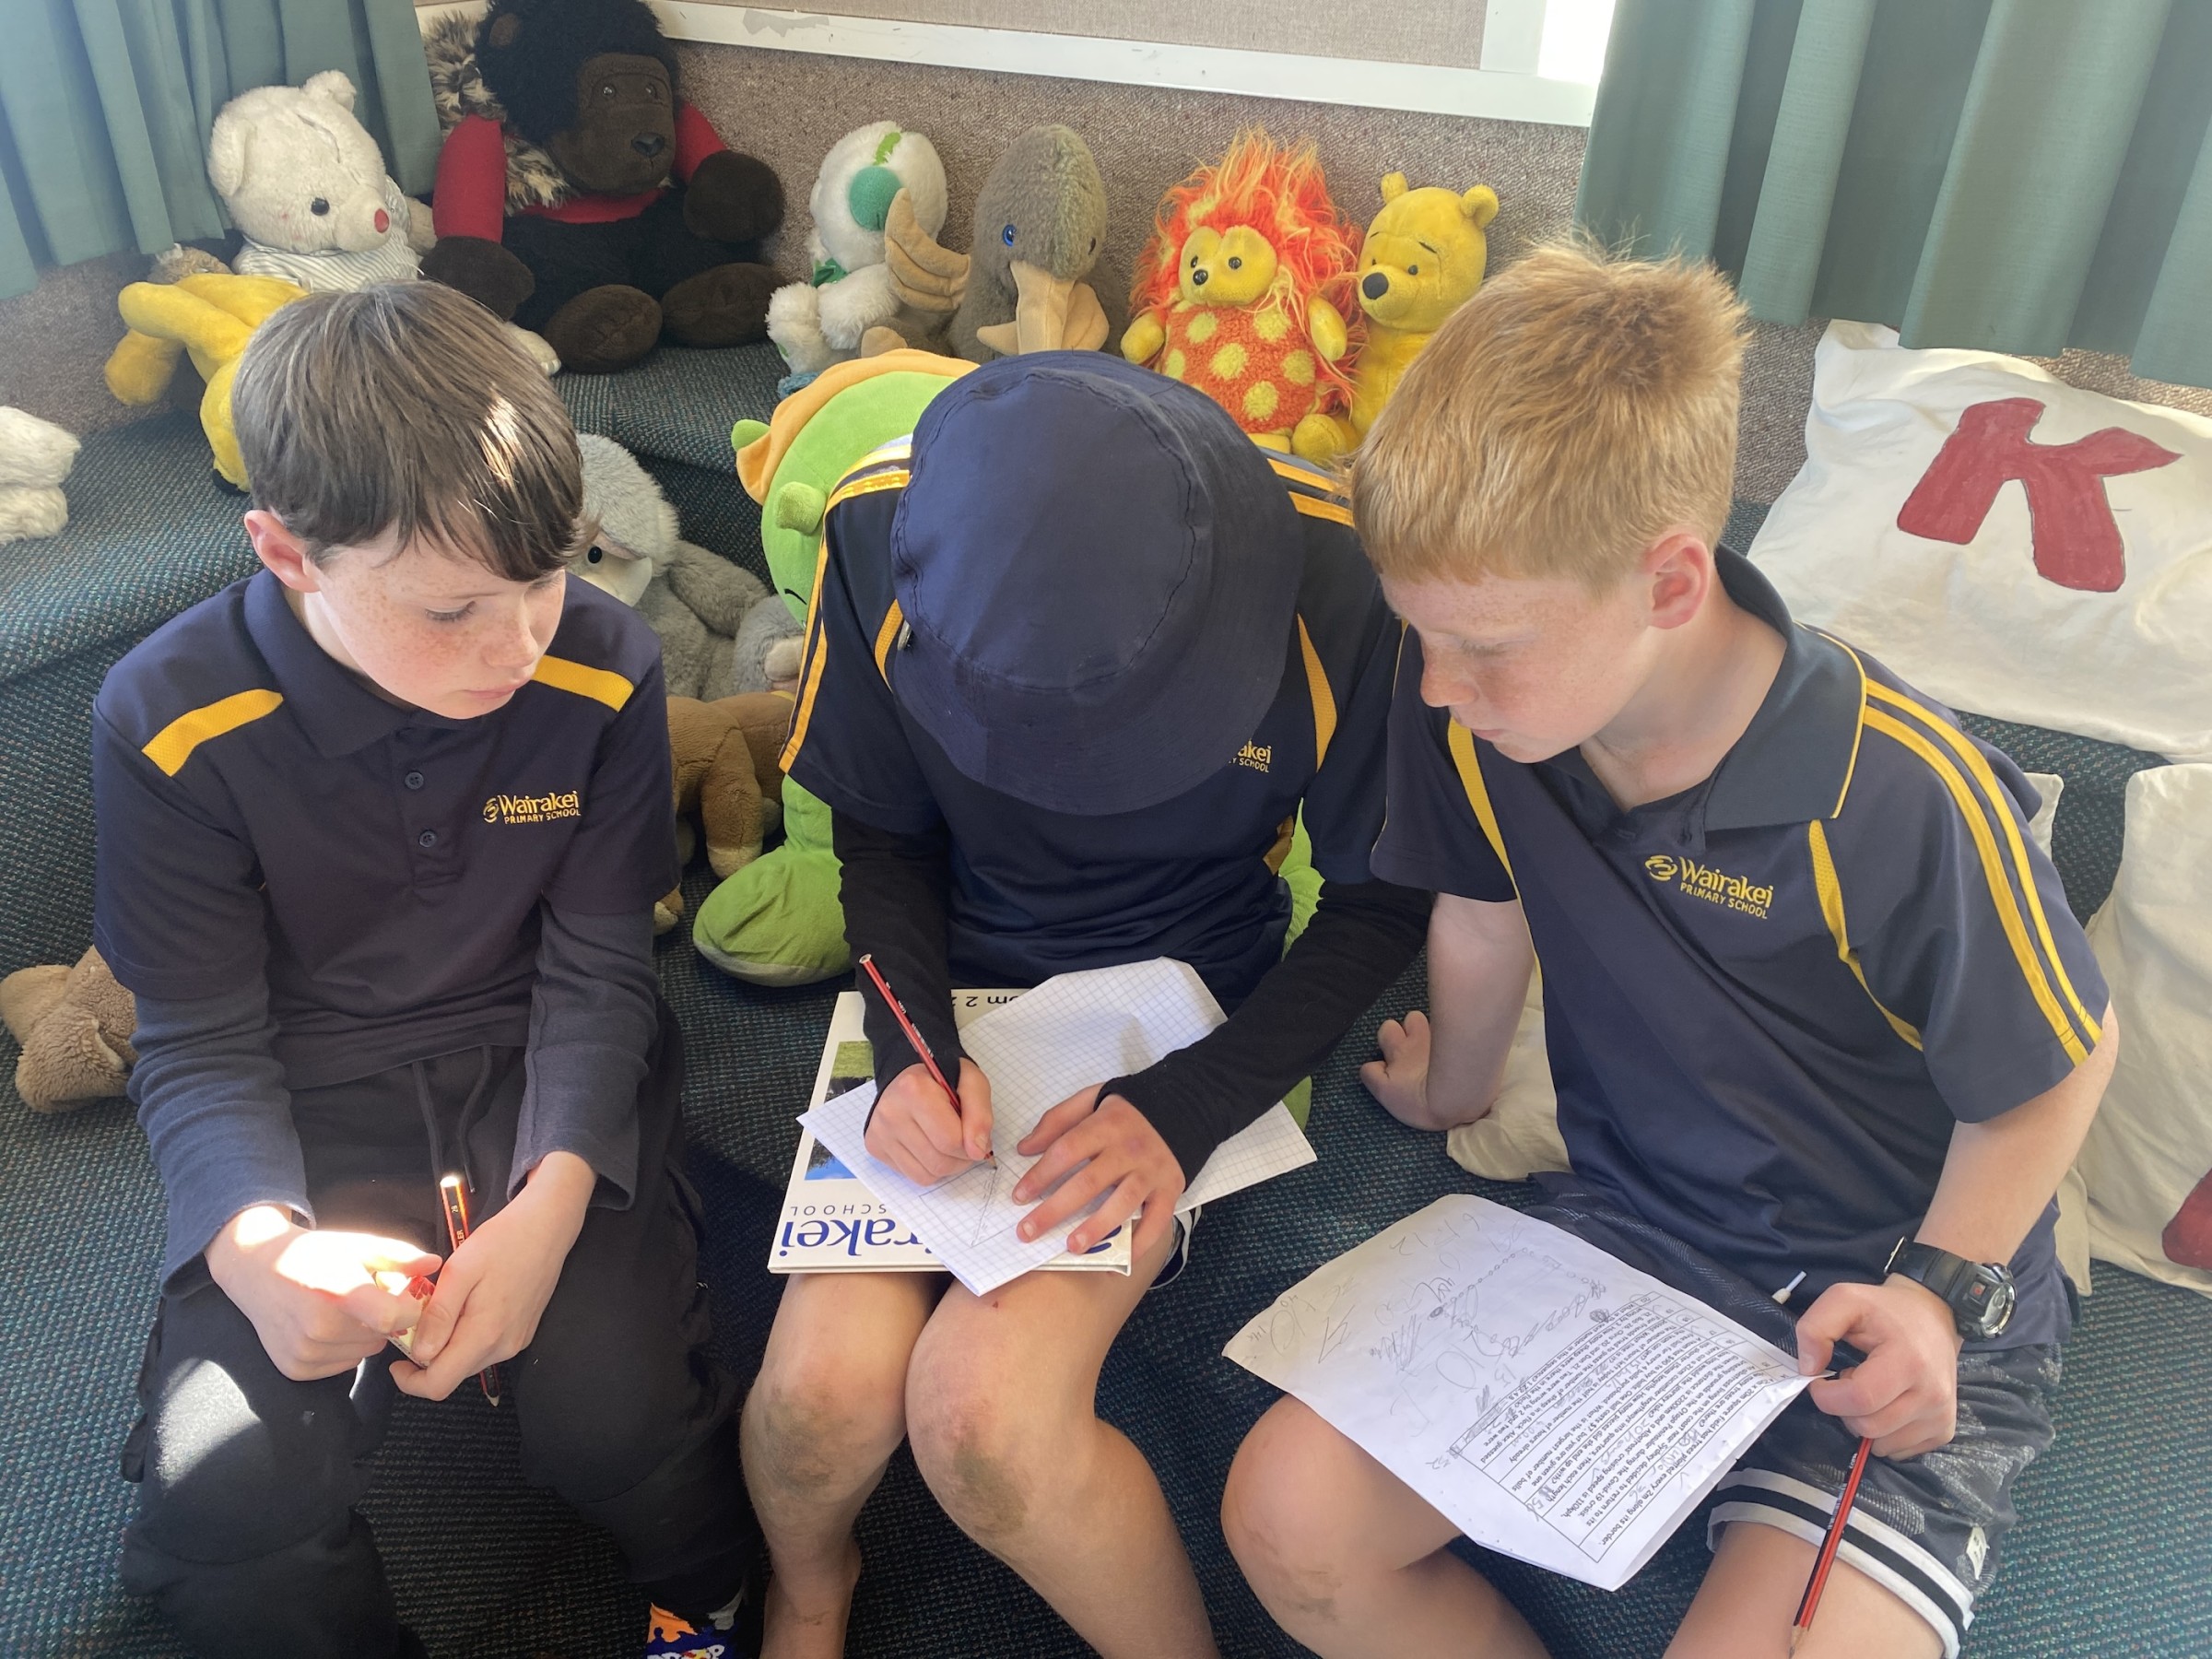
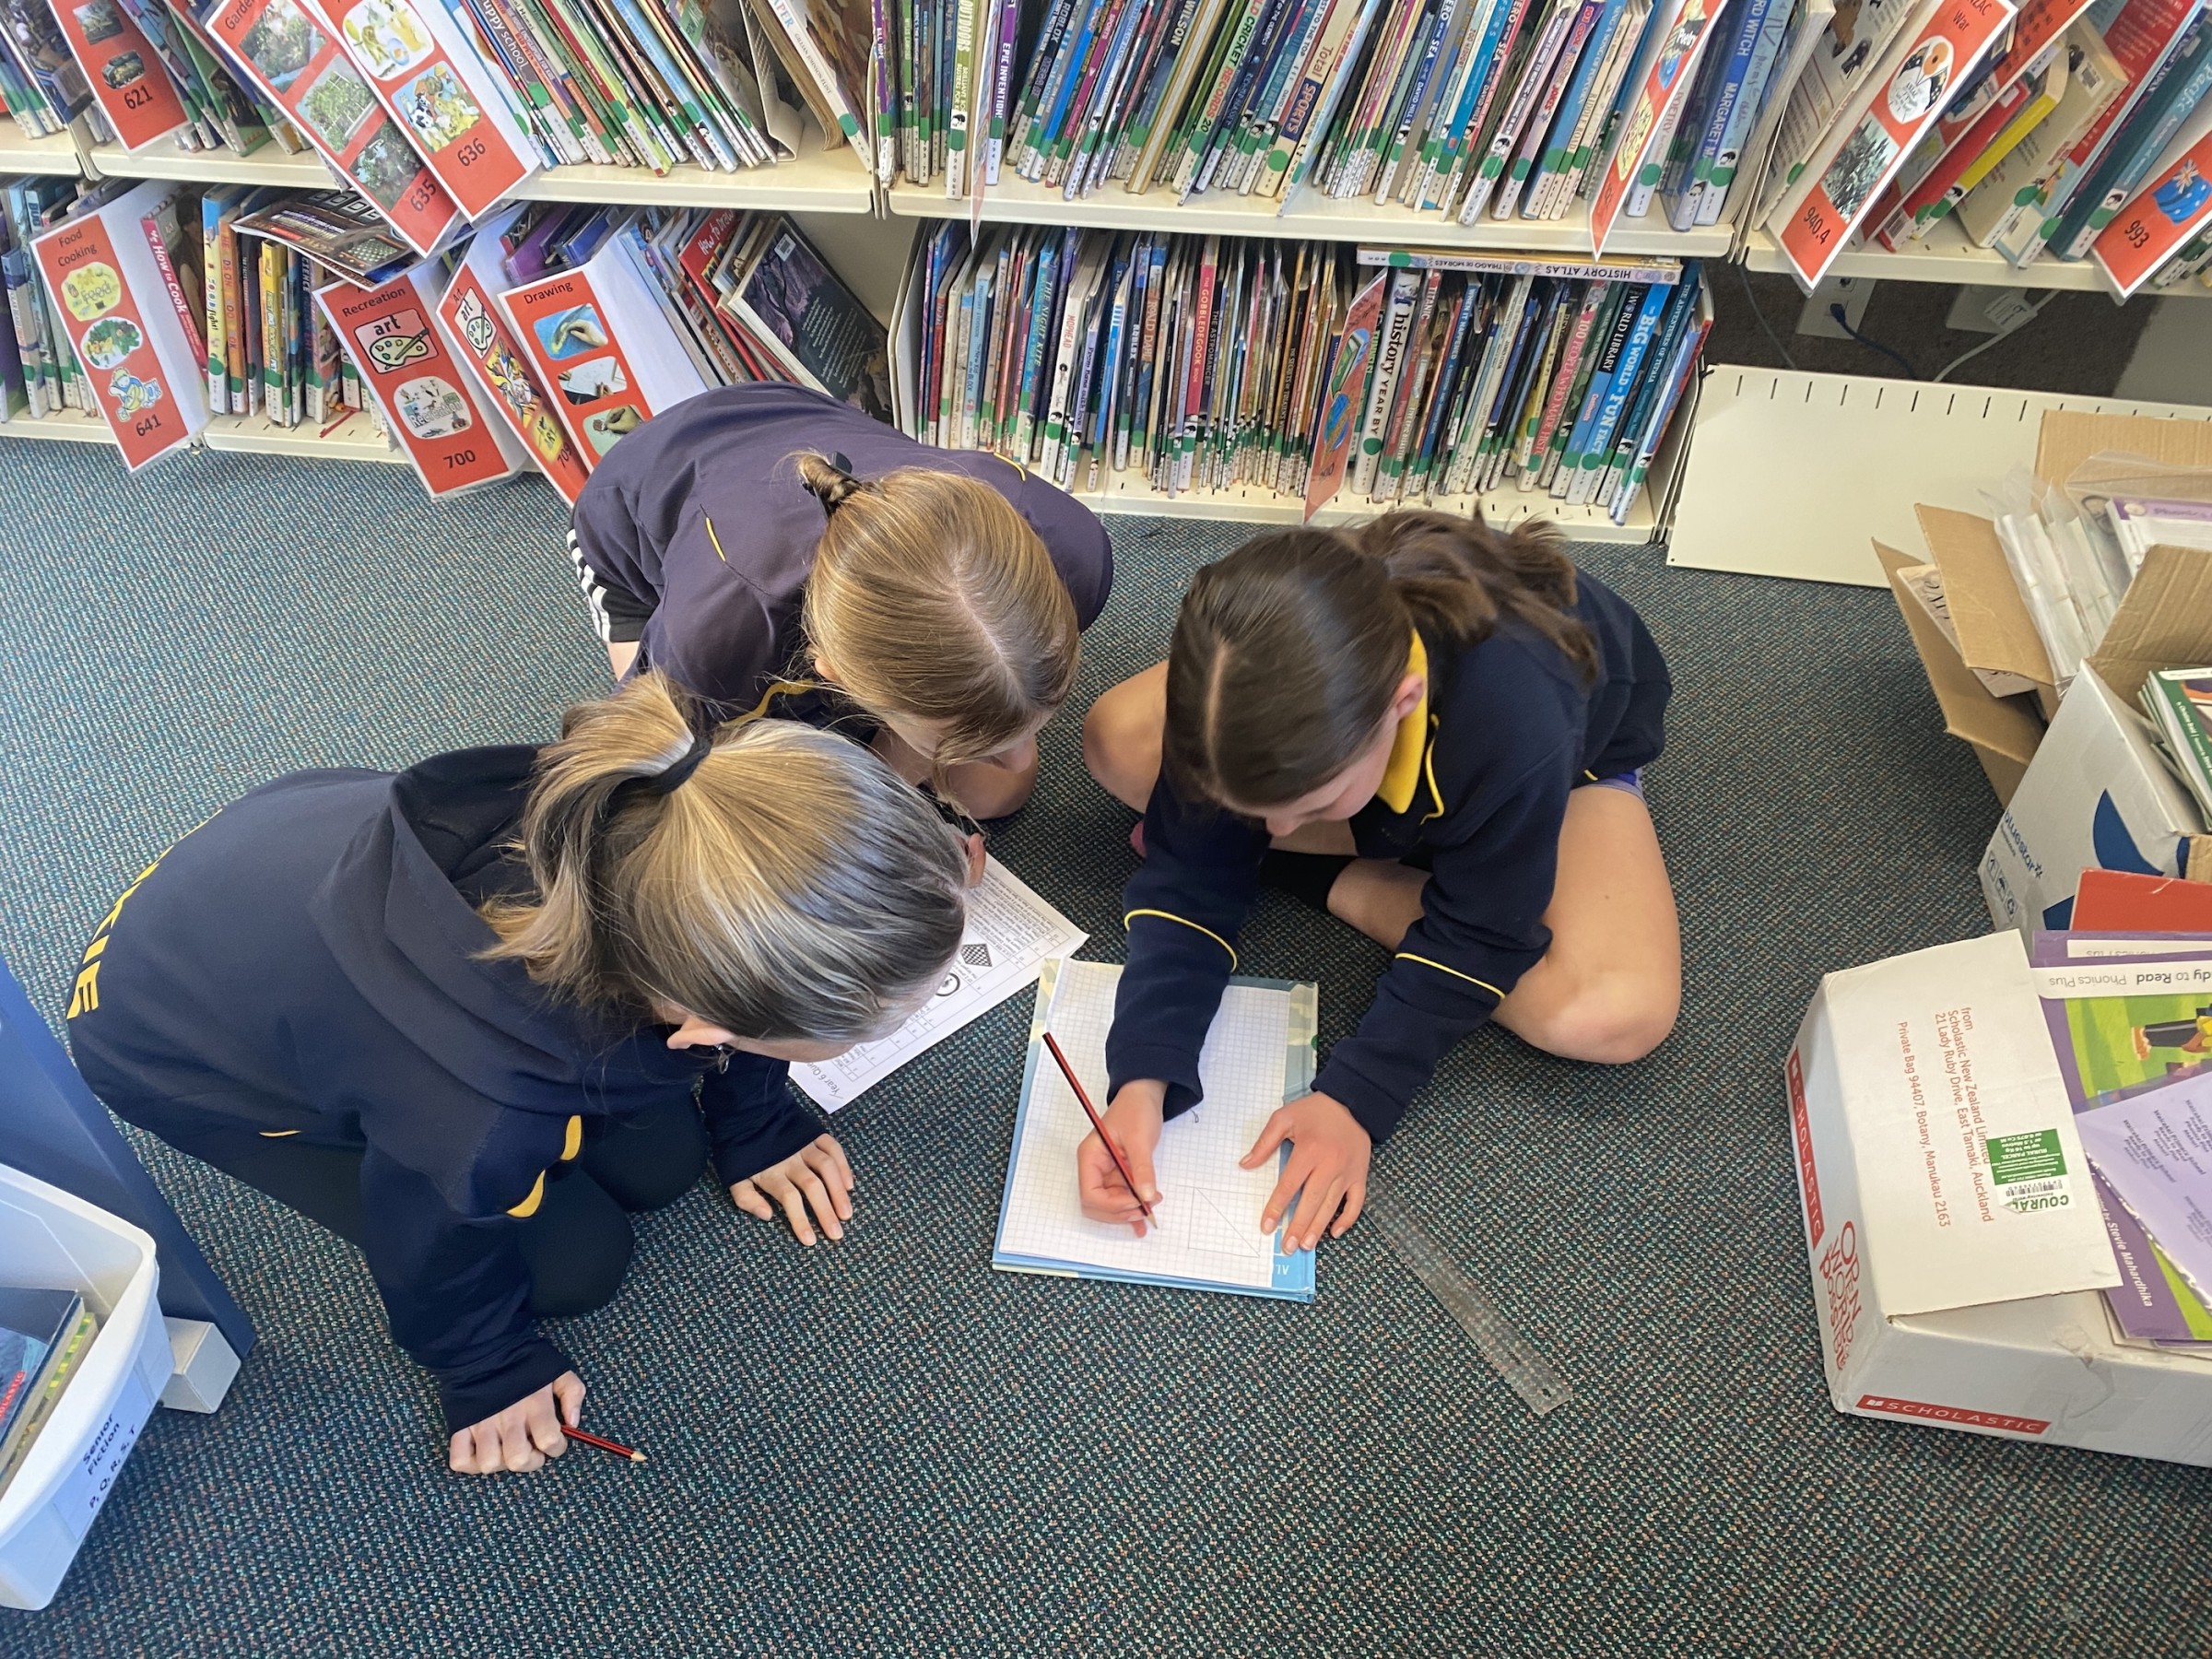
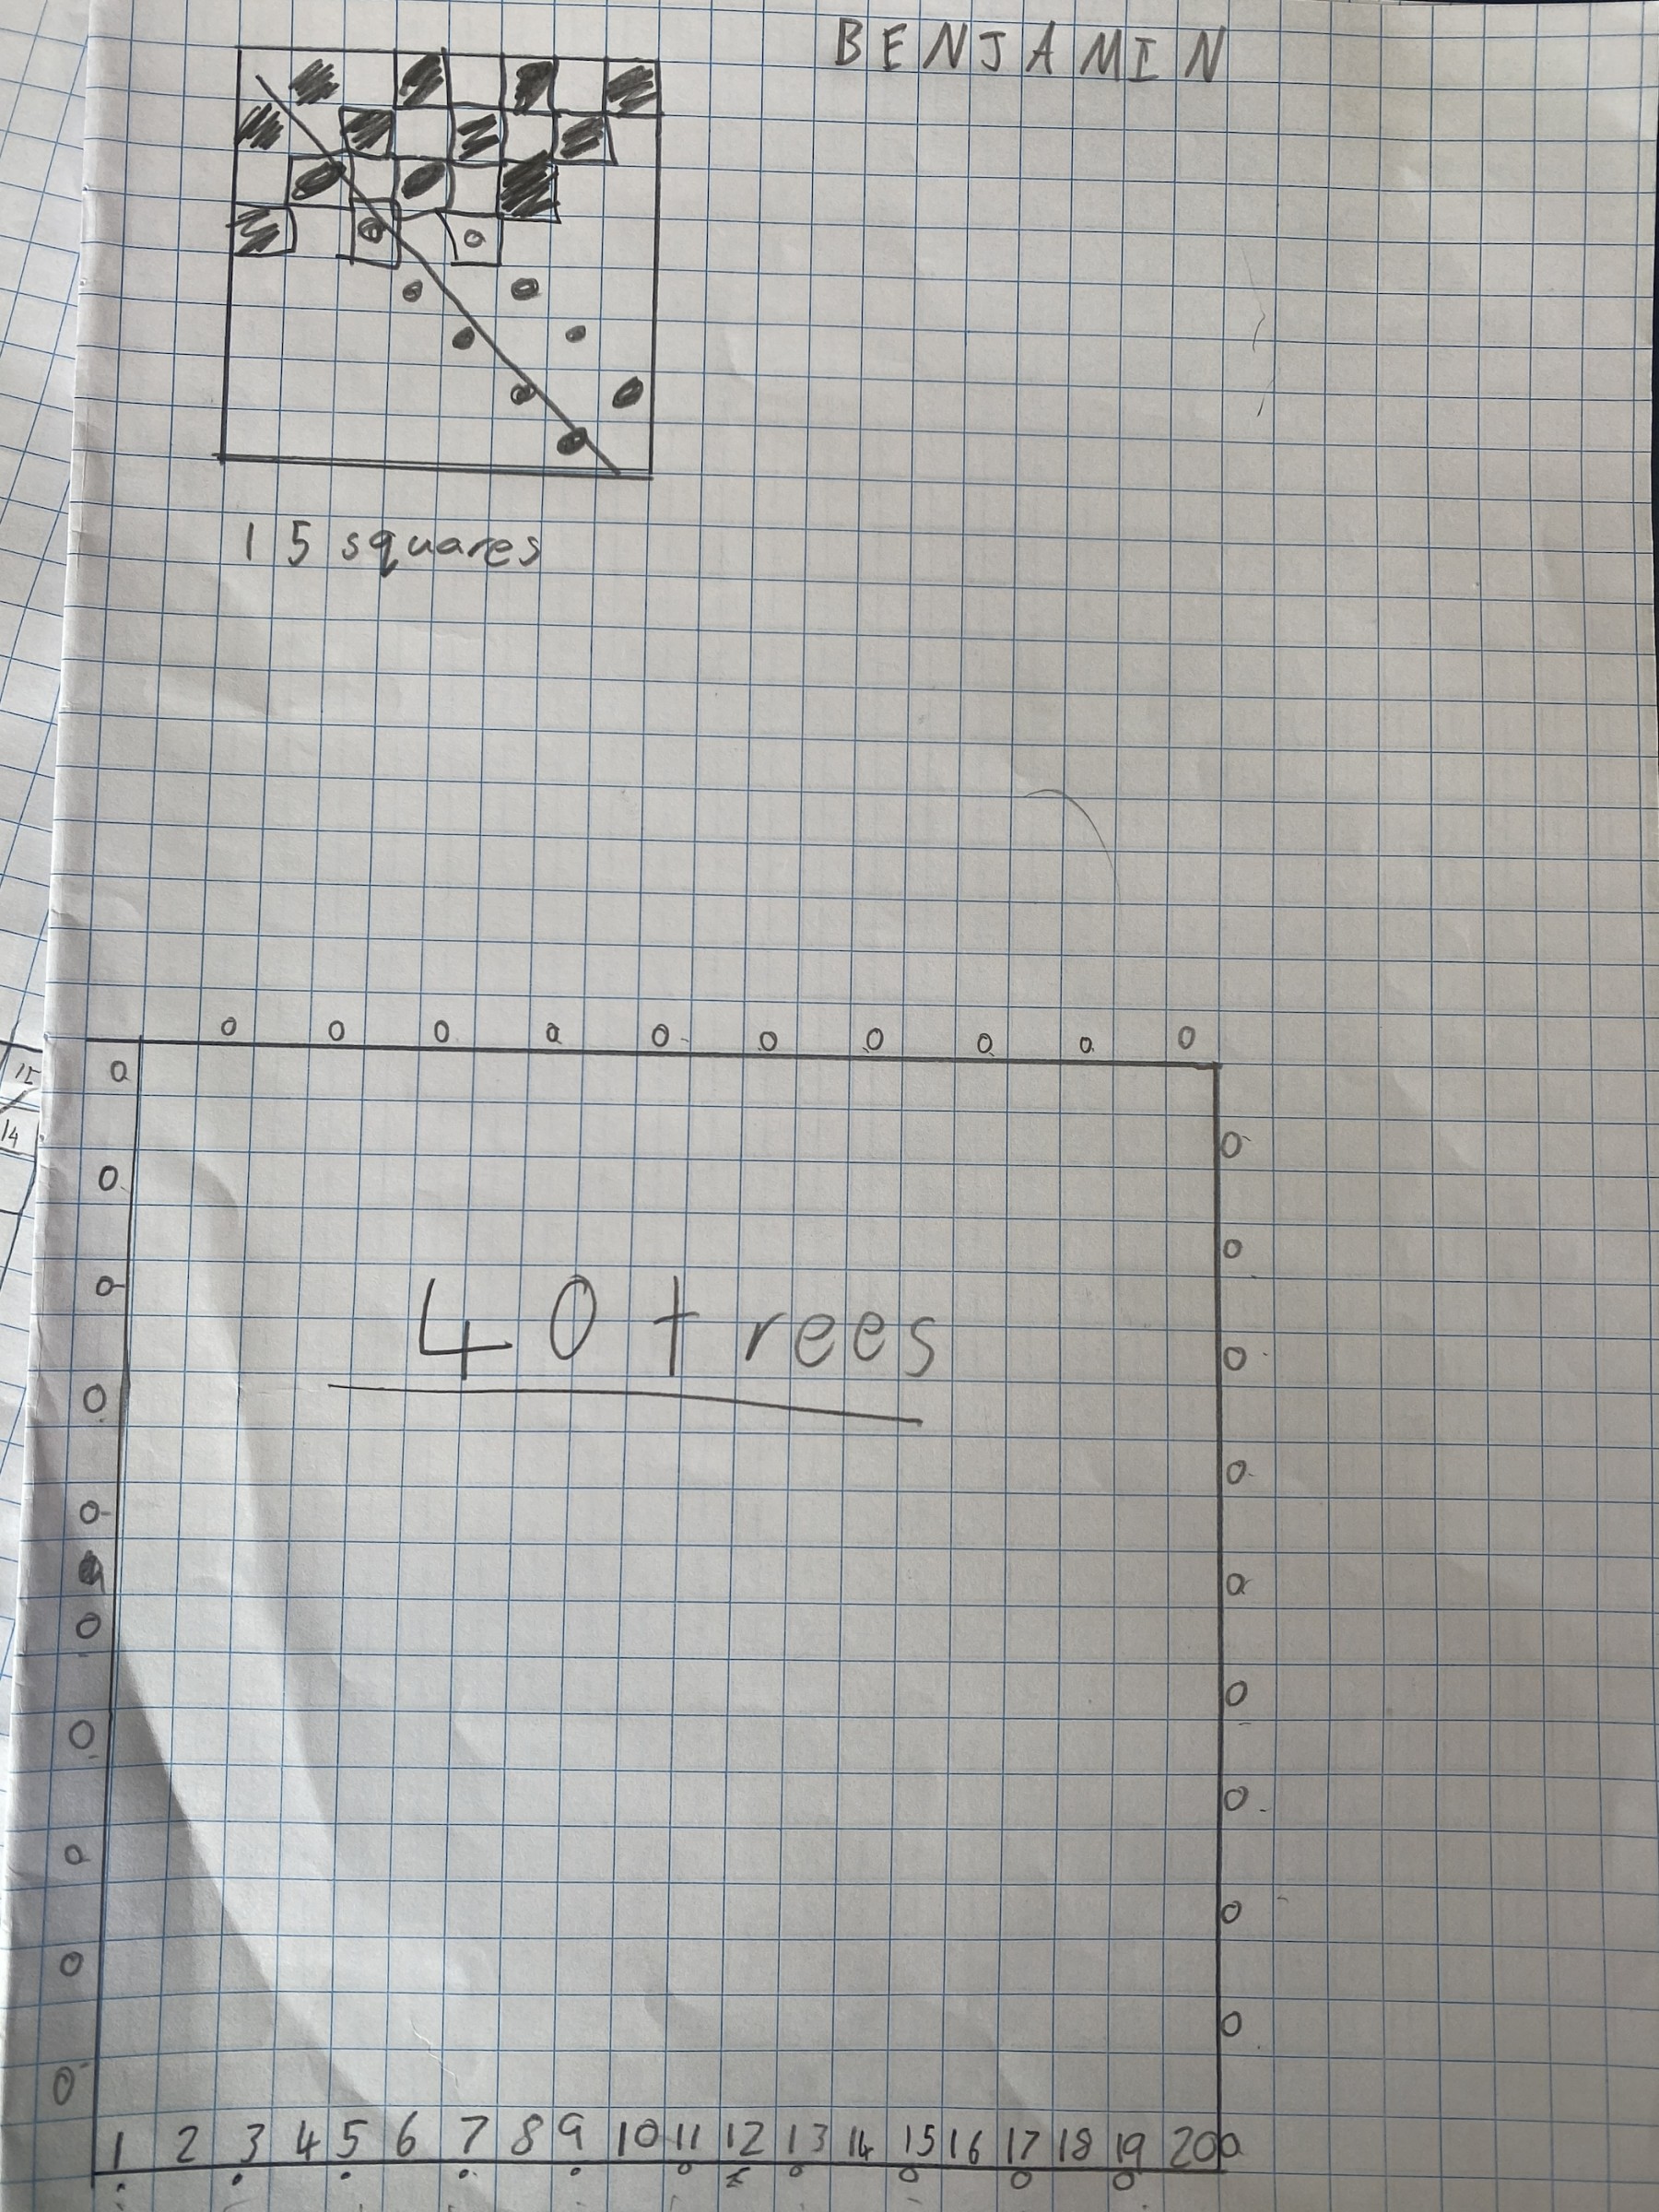
The maths matters students were asked to draw a to-scale diagram of the tree planting on the grid paper to prove to me how many trees were planted.
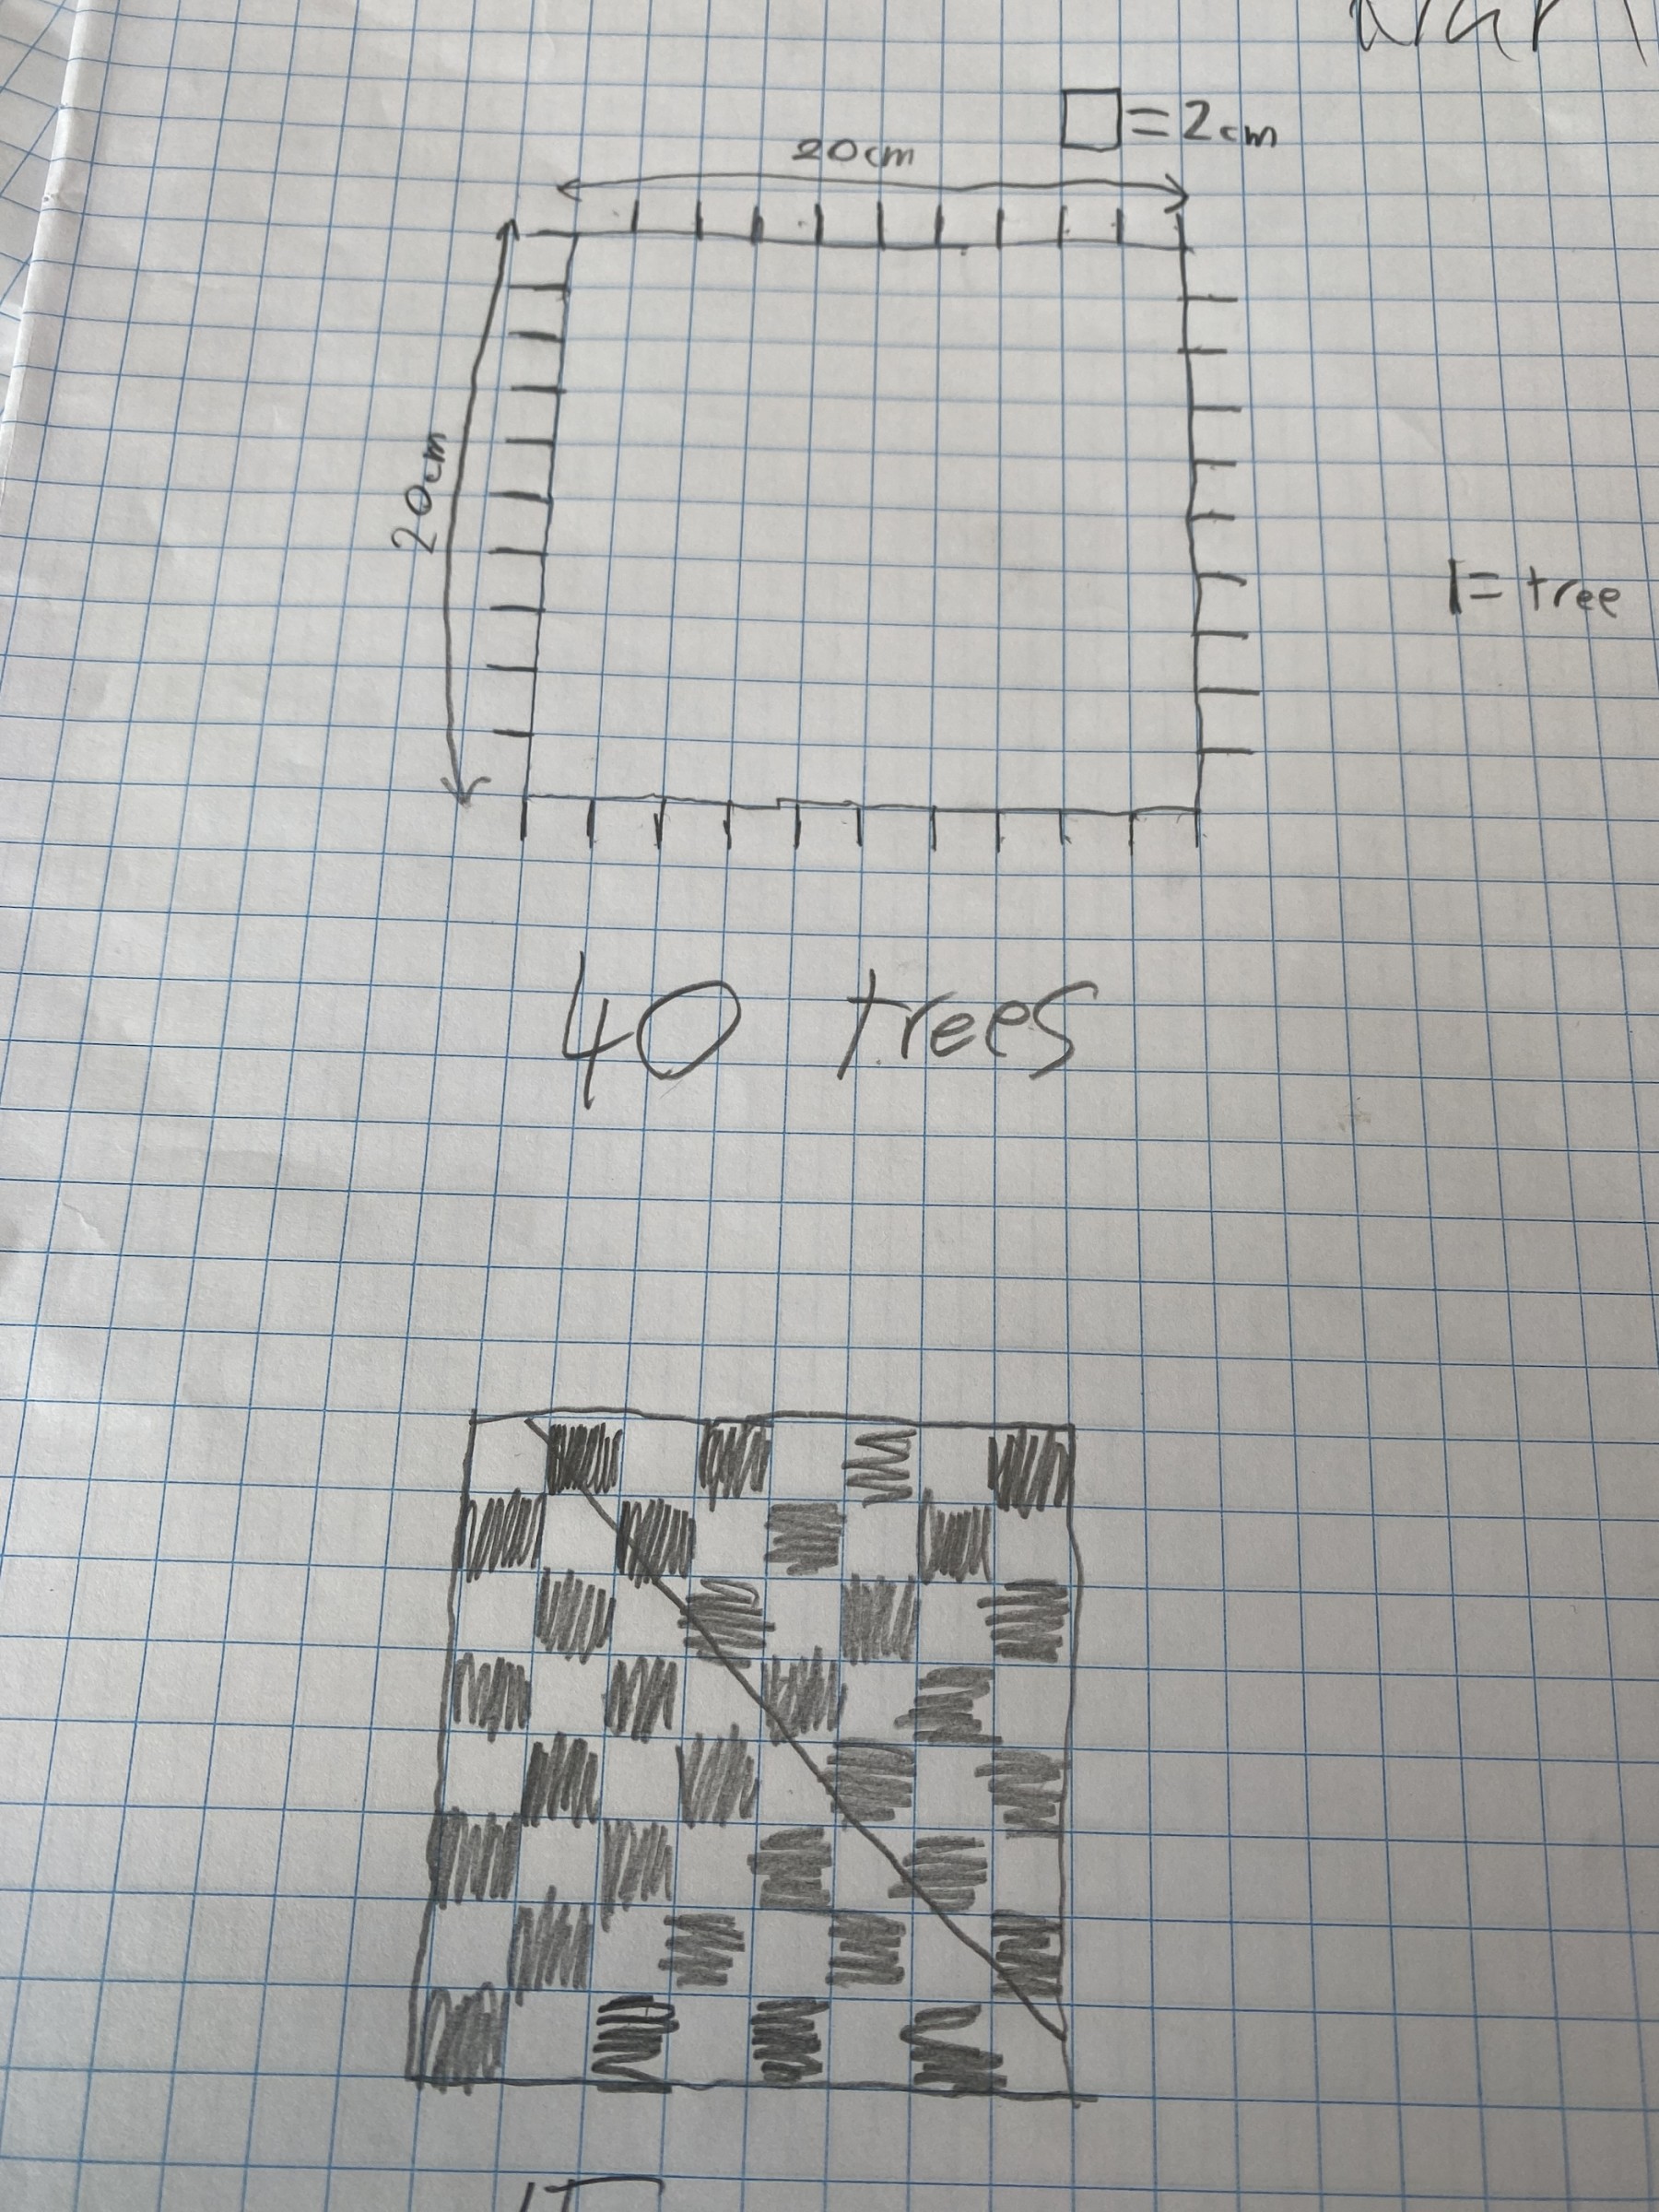
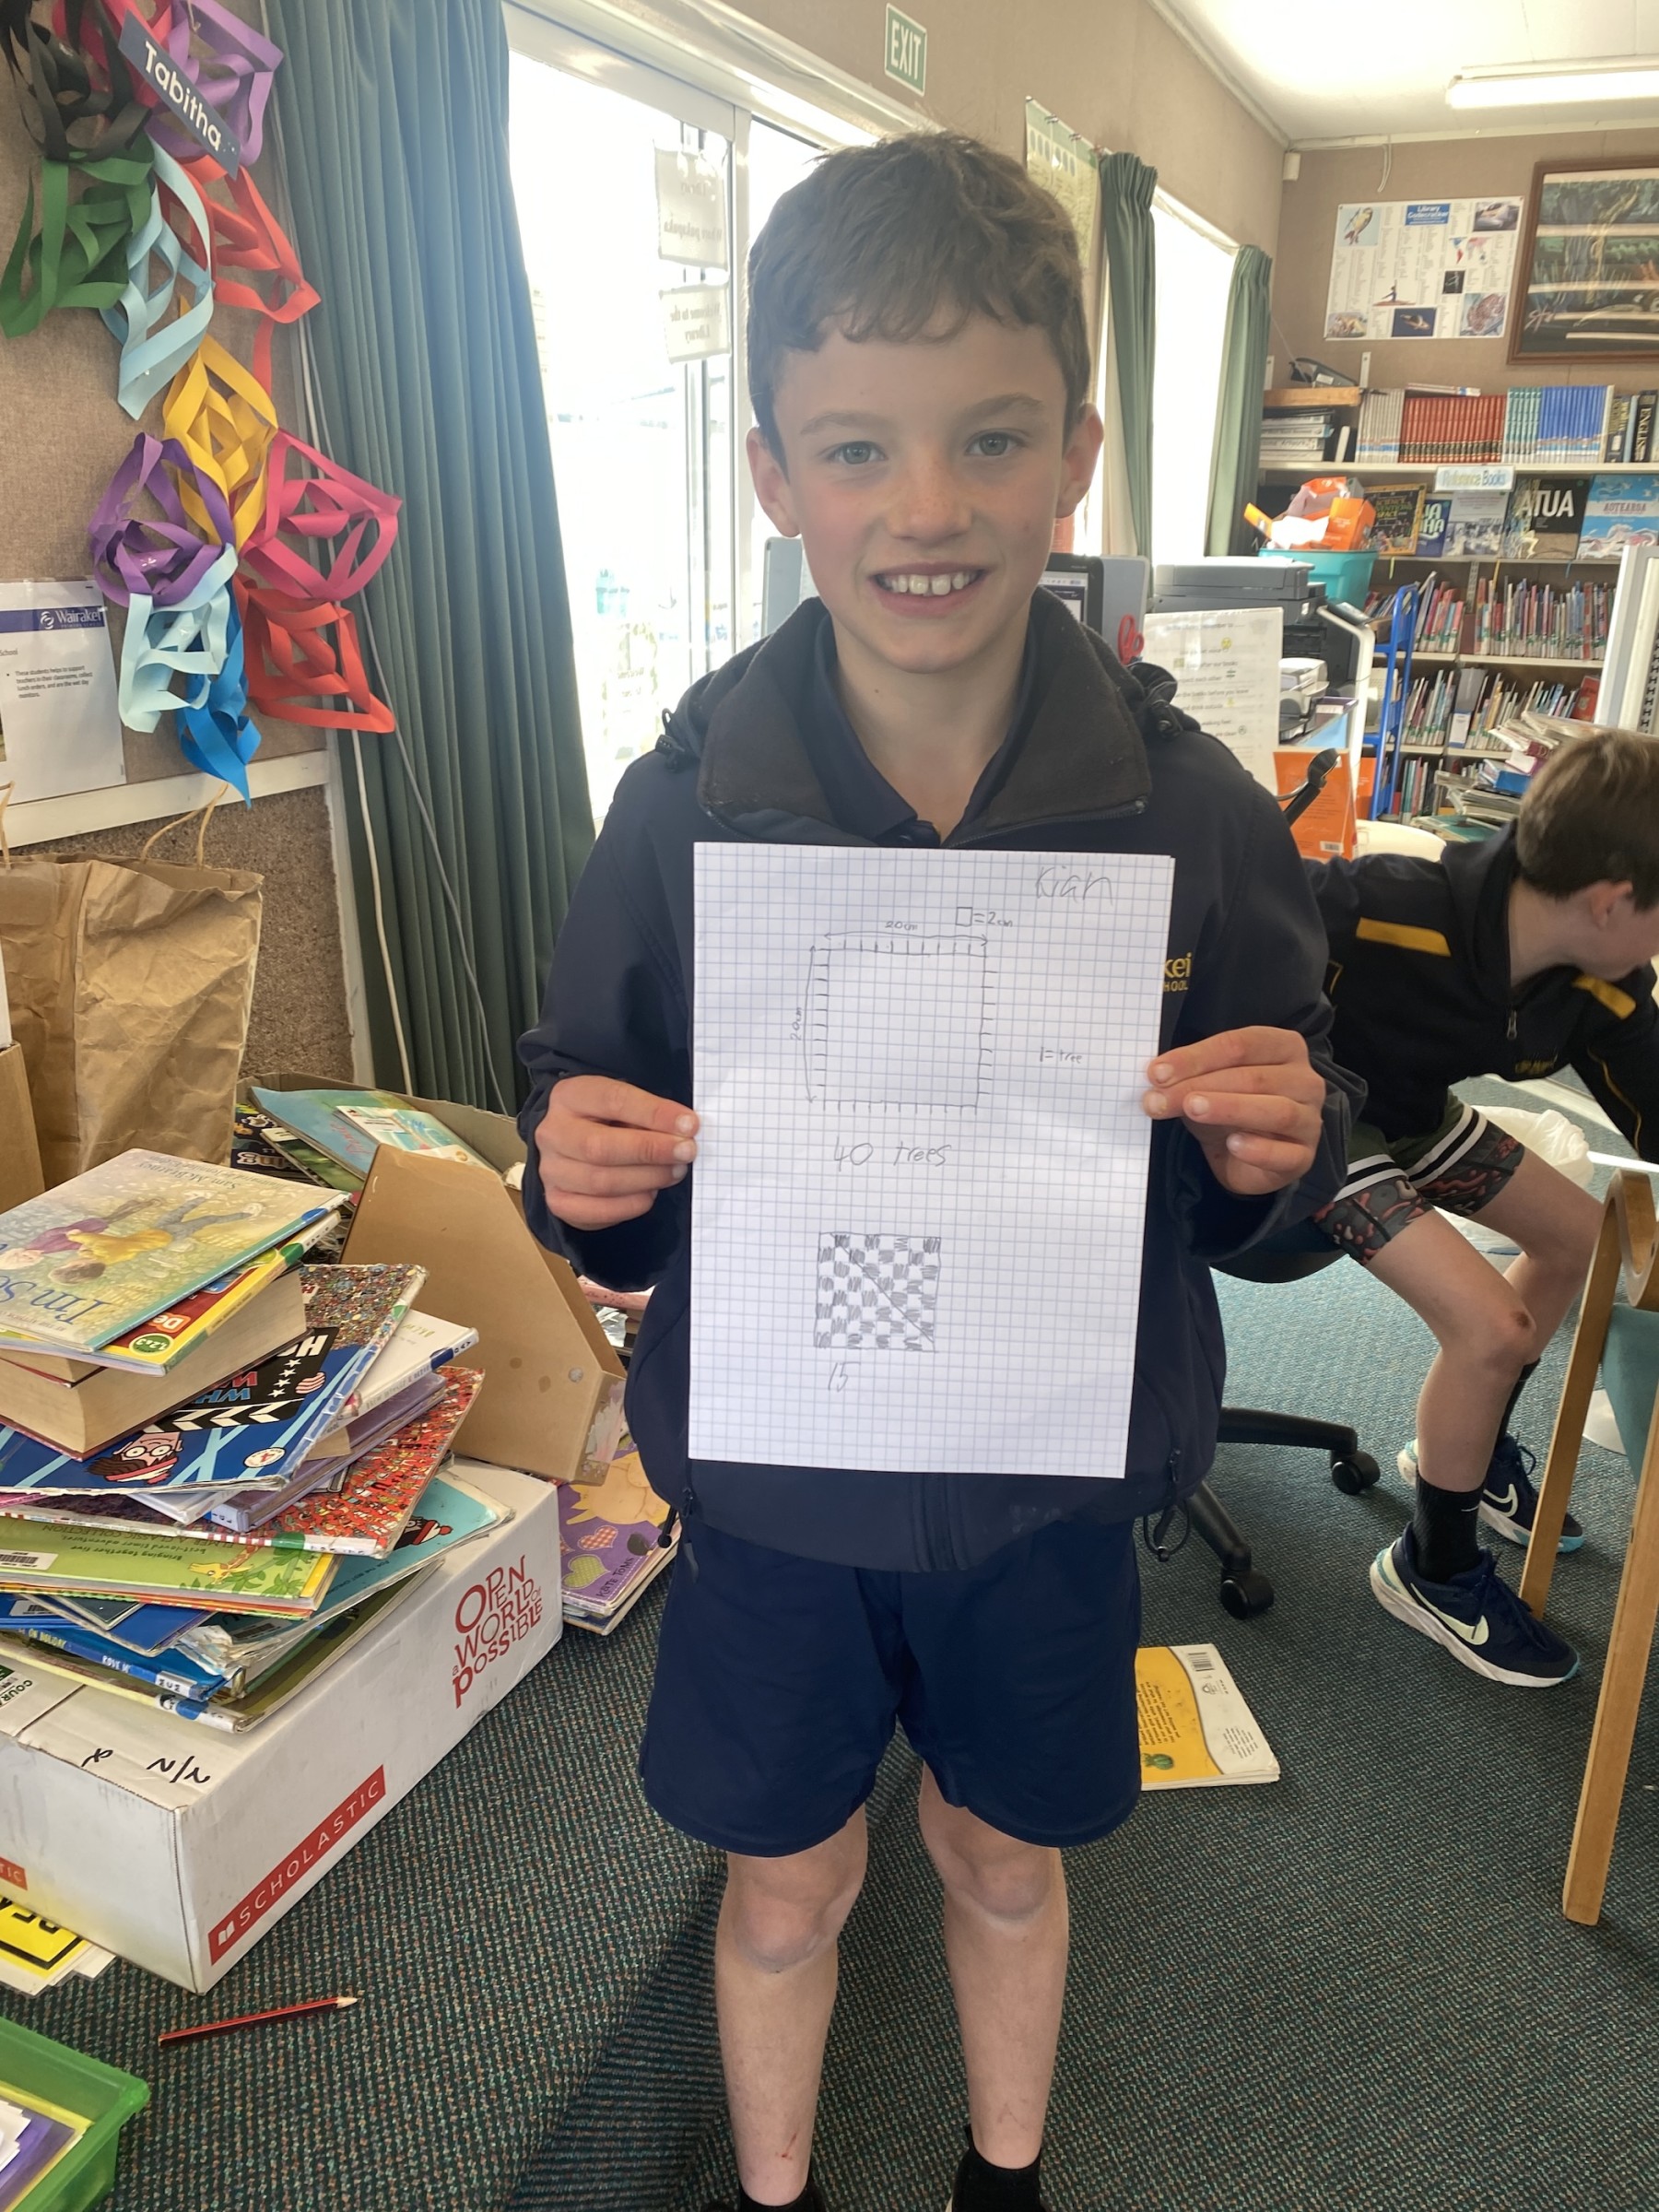
They were also asked to draw a chessboard and then create the line running through the board showing the largest number of squares it could go through.
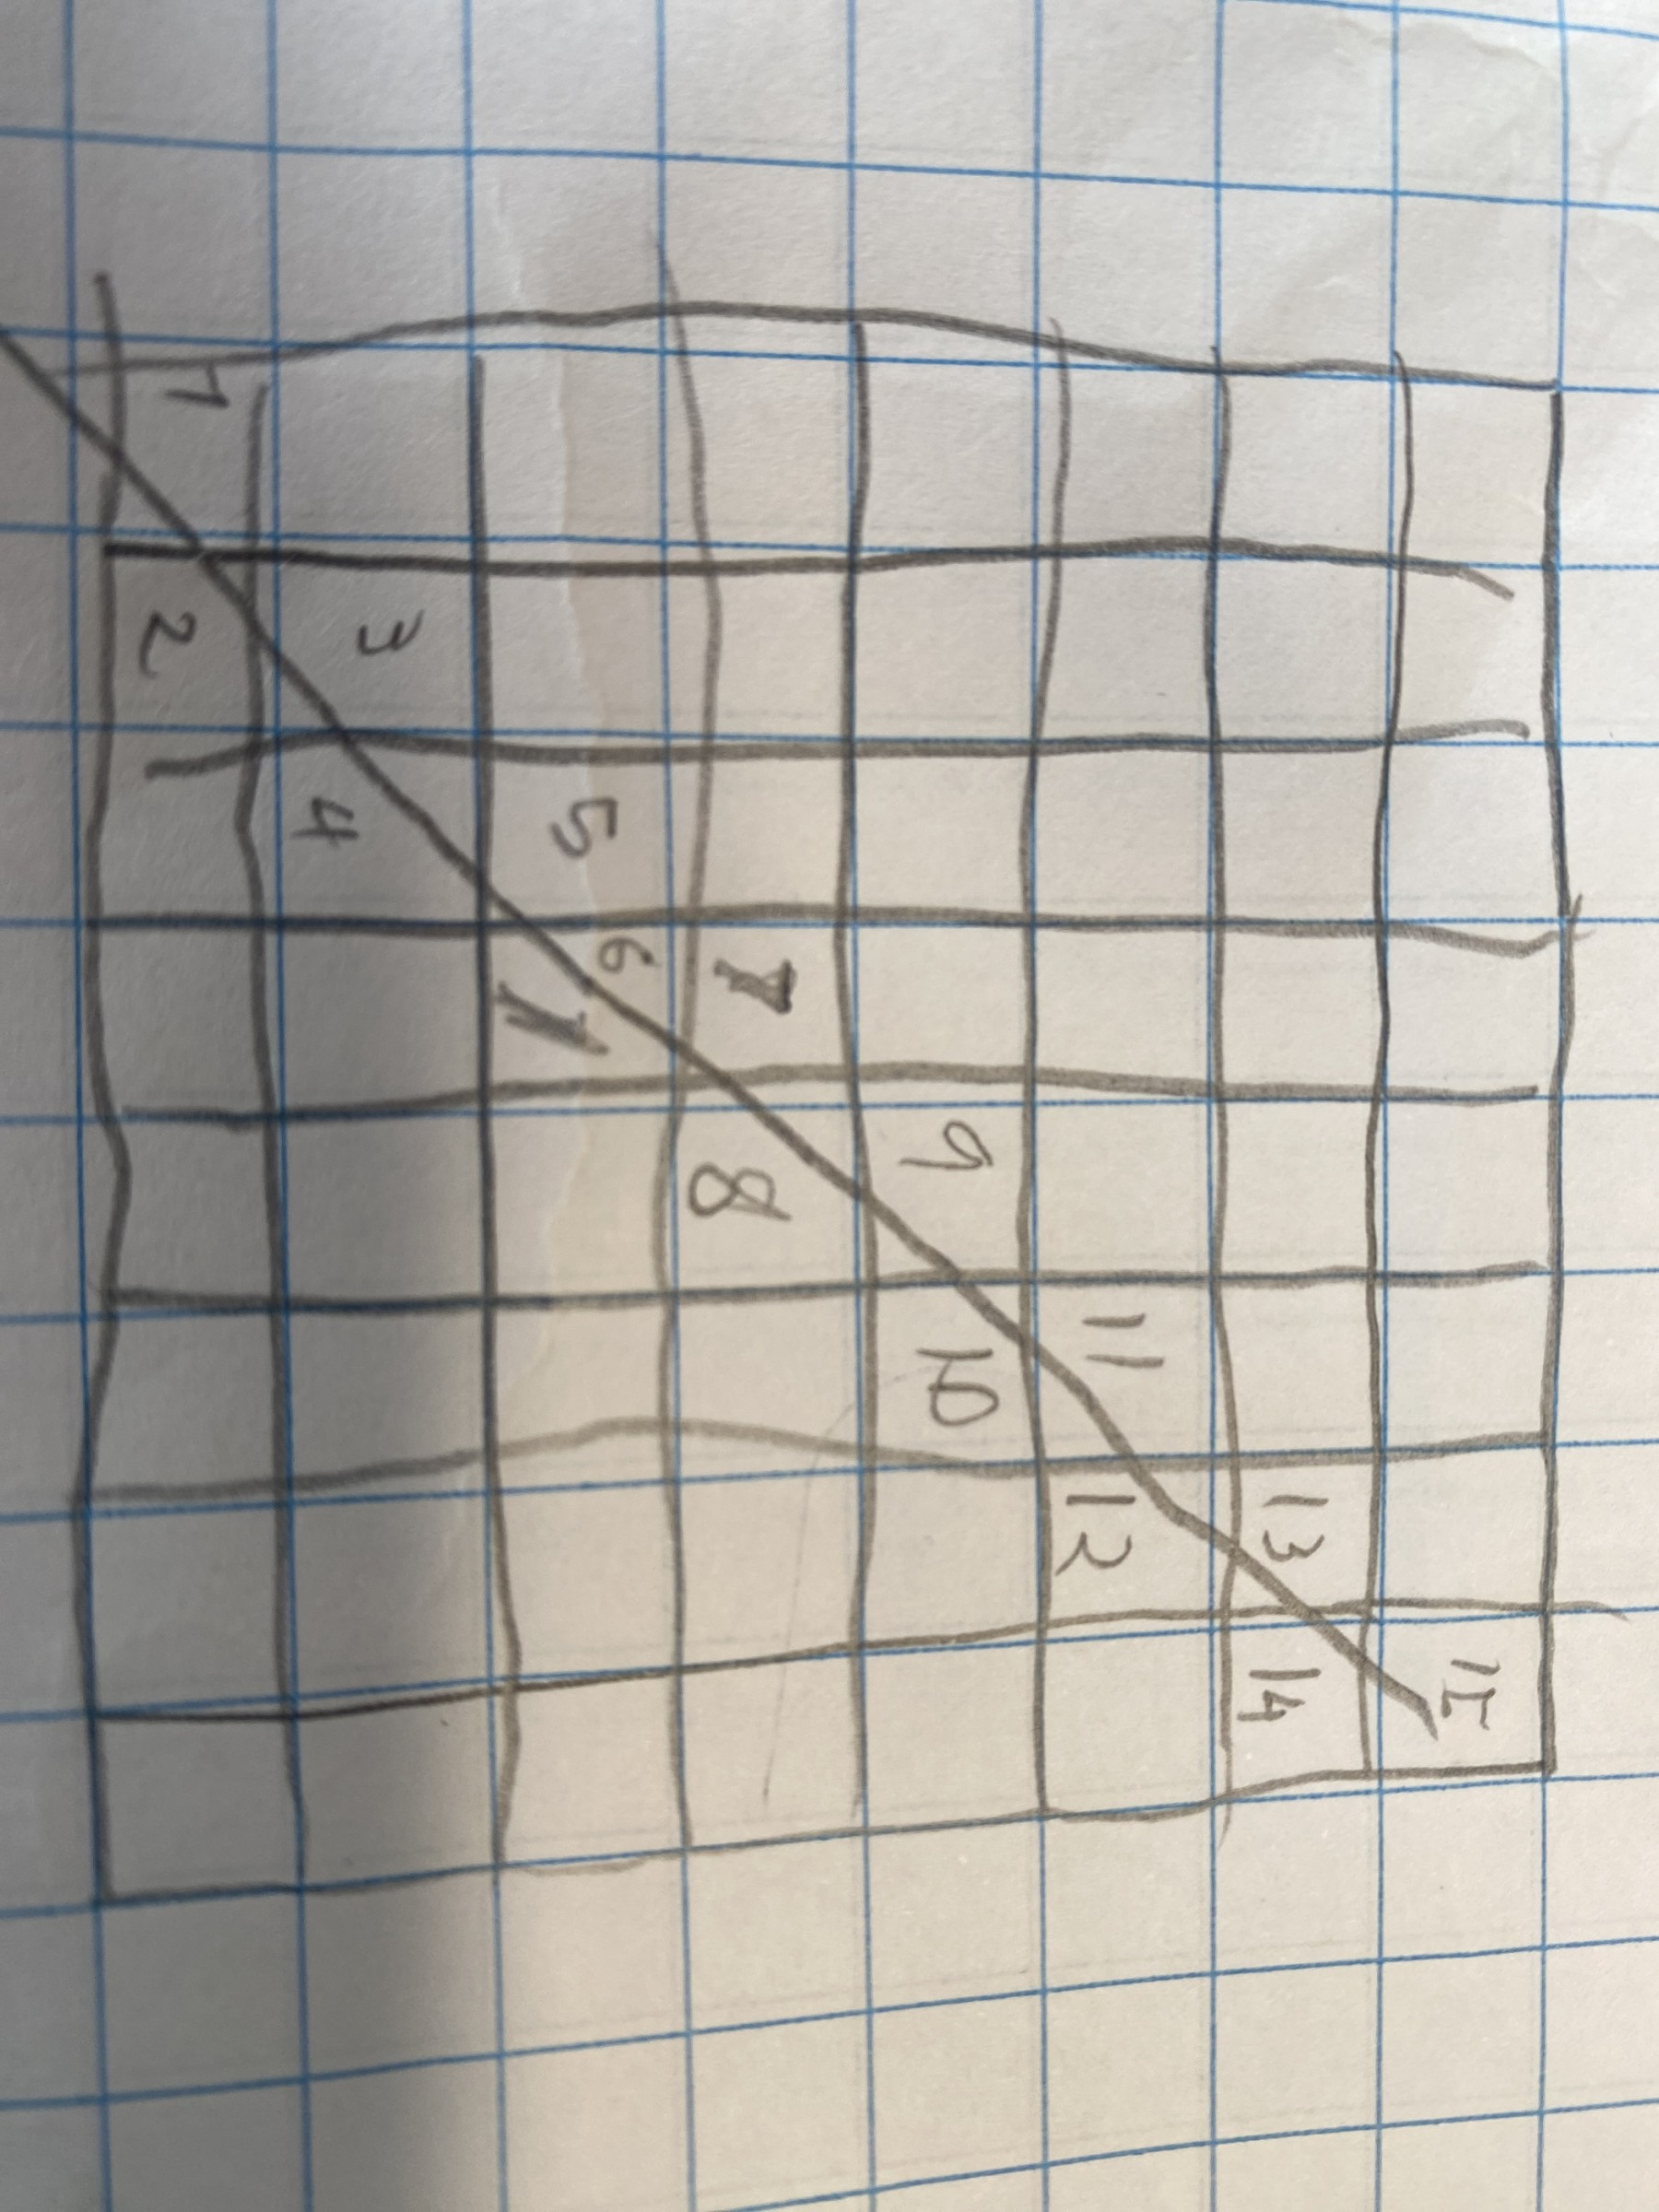
My diagram shows how the diagonal goes through 15 squares on the chessboard
I drew a chessboard and put a diagonal line through it, and now I can see the 15 squares. I couldn’t see it before
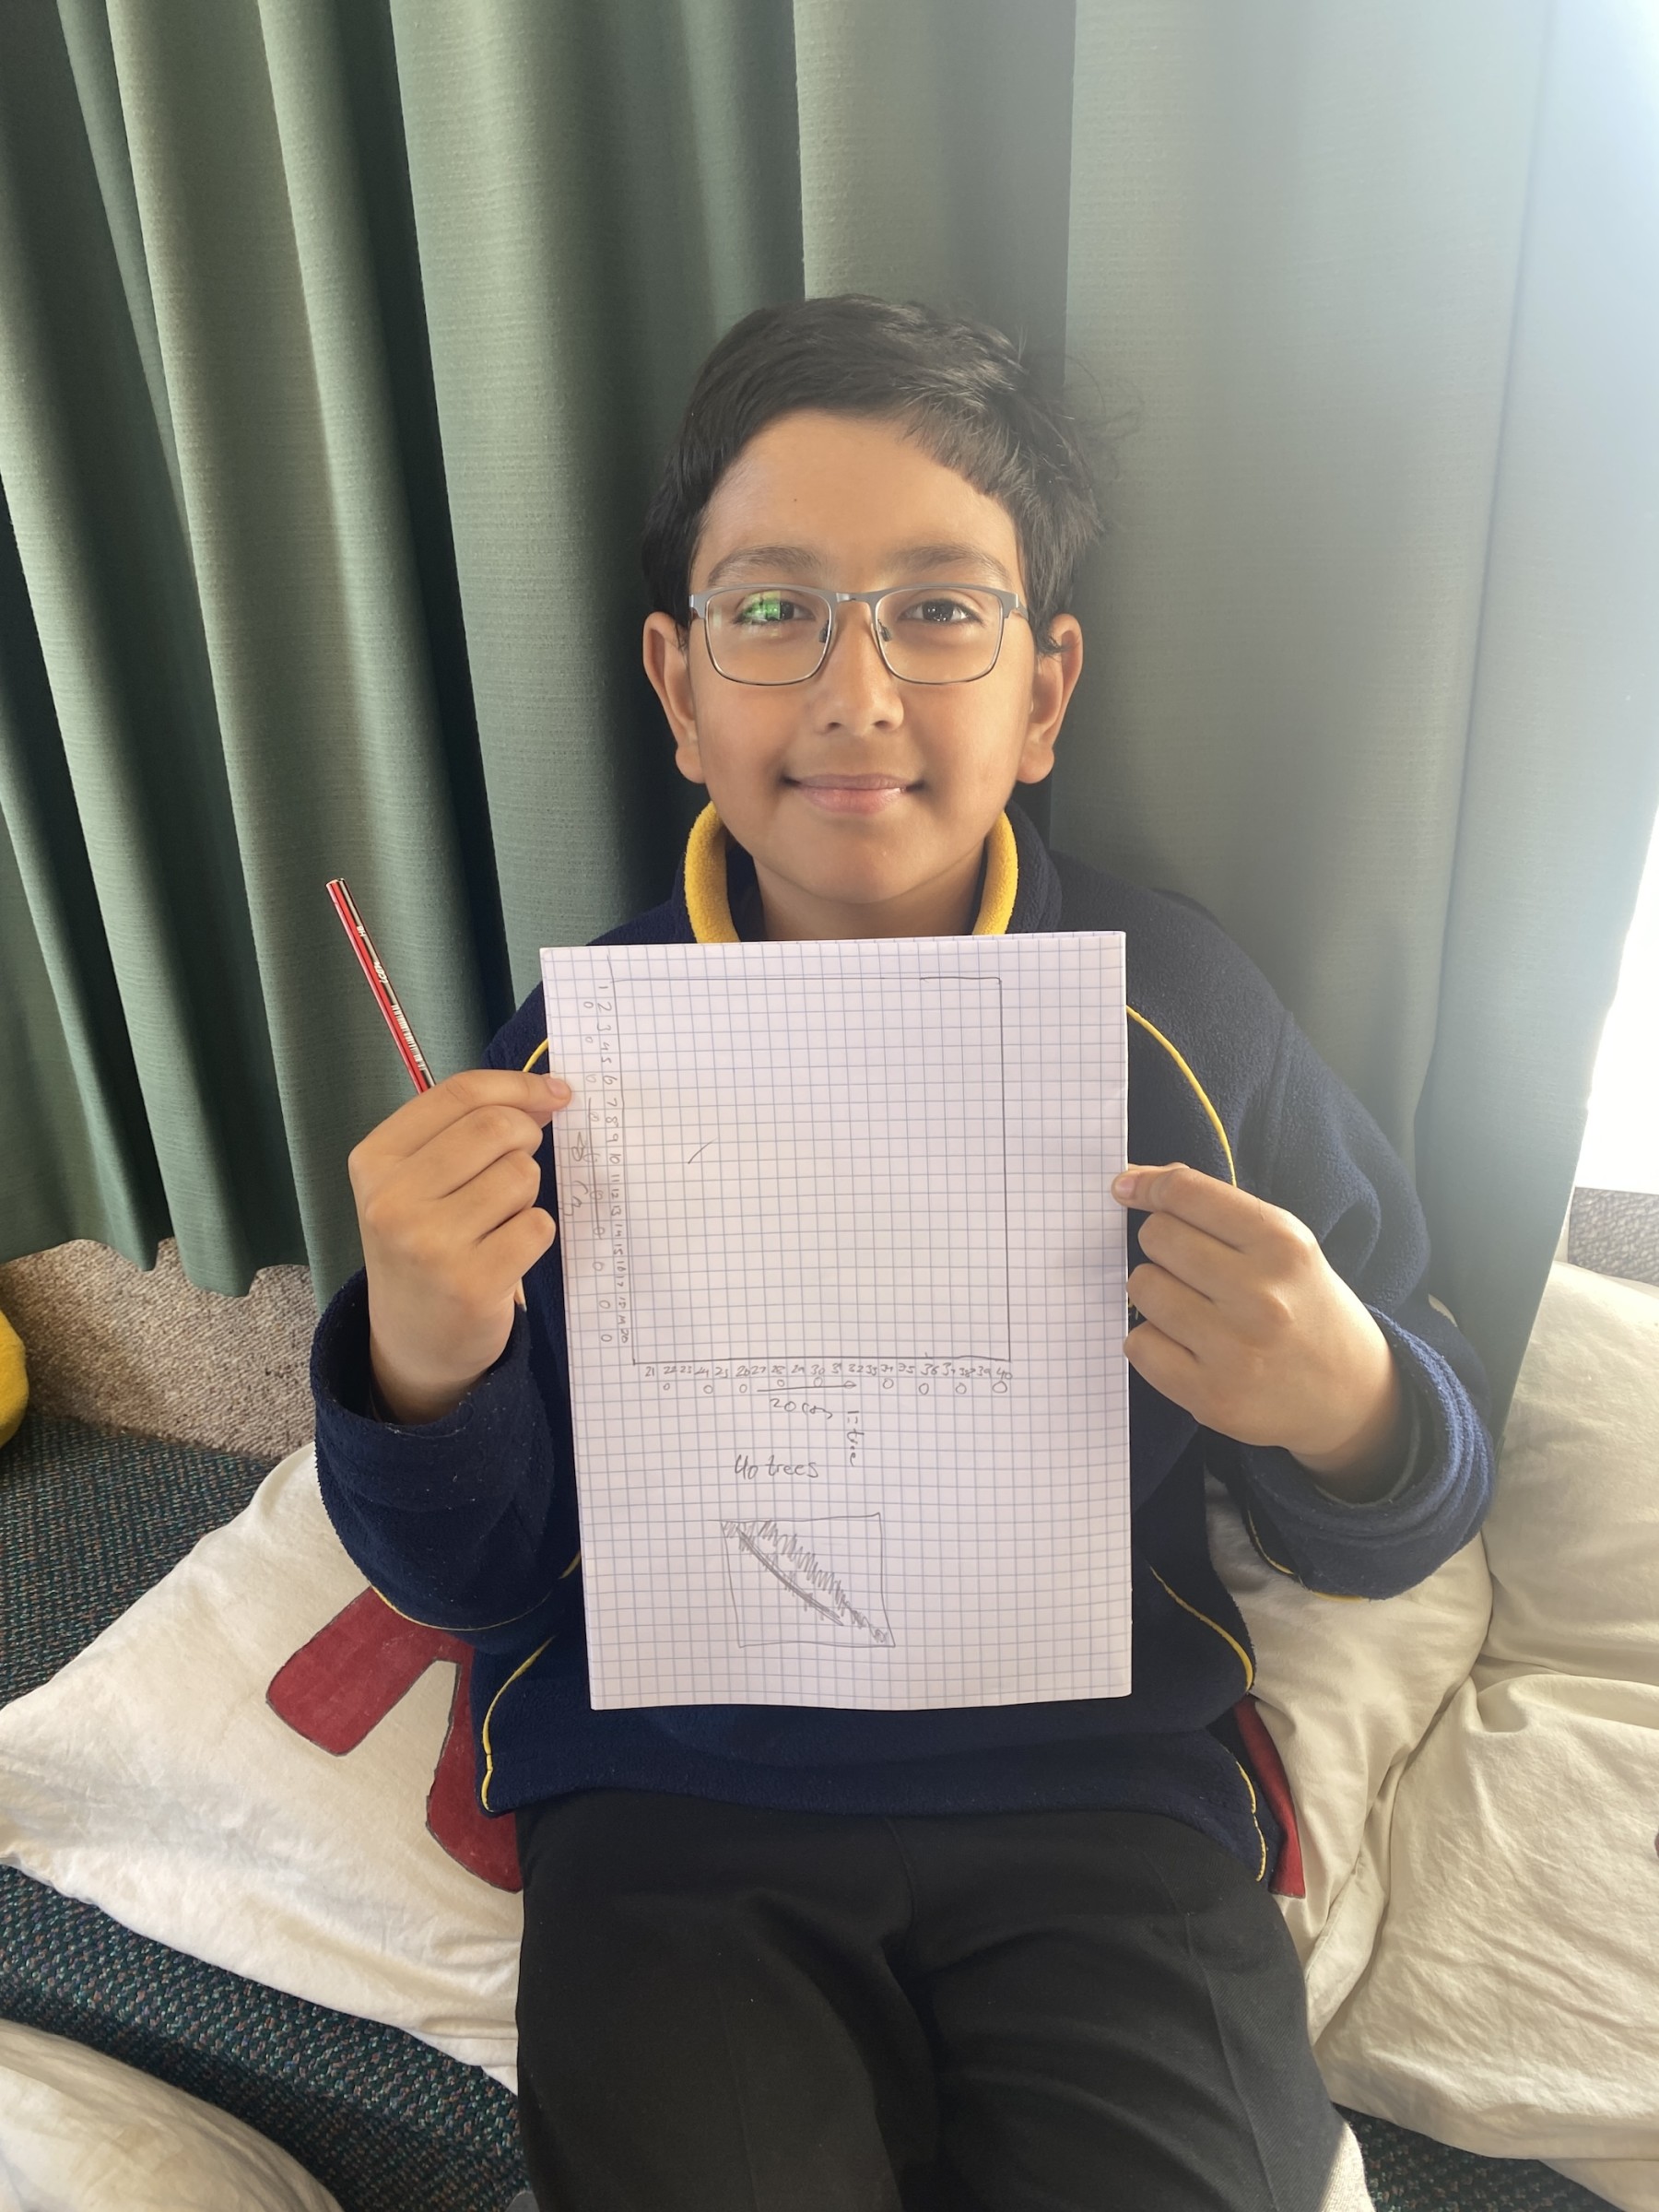
For the tree problem, each square on the grid paper is equal to 1 metre
Measuring two metres around the corner of the square was confusing, I had to do this several times because I kept making mistakes.
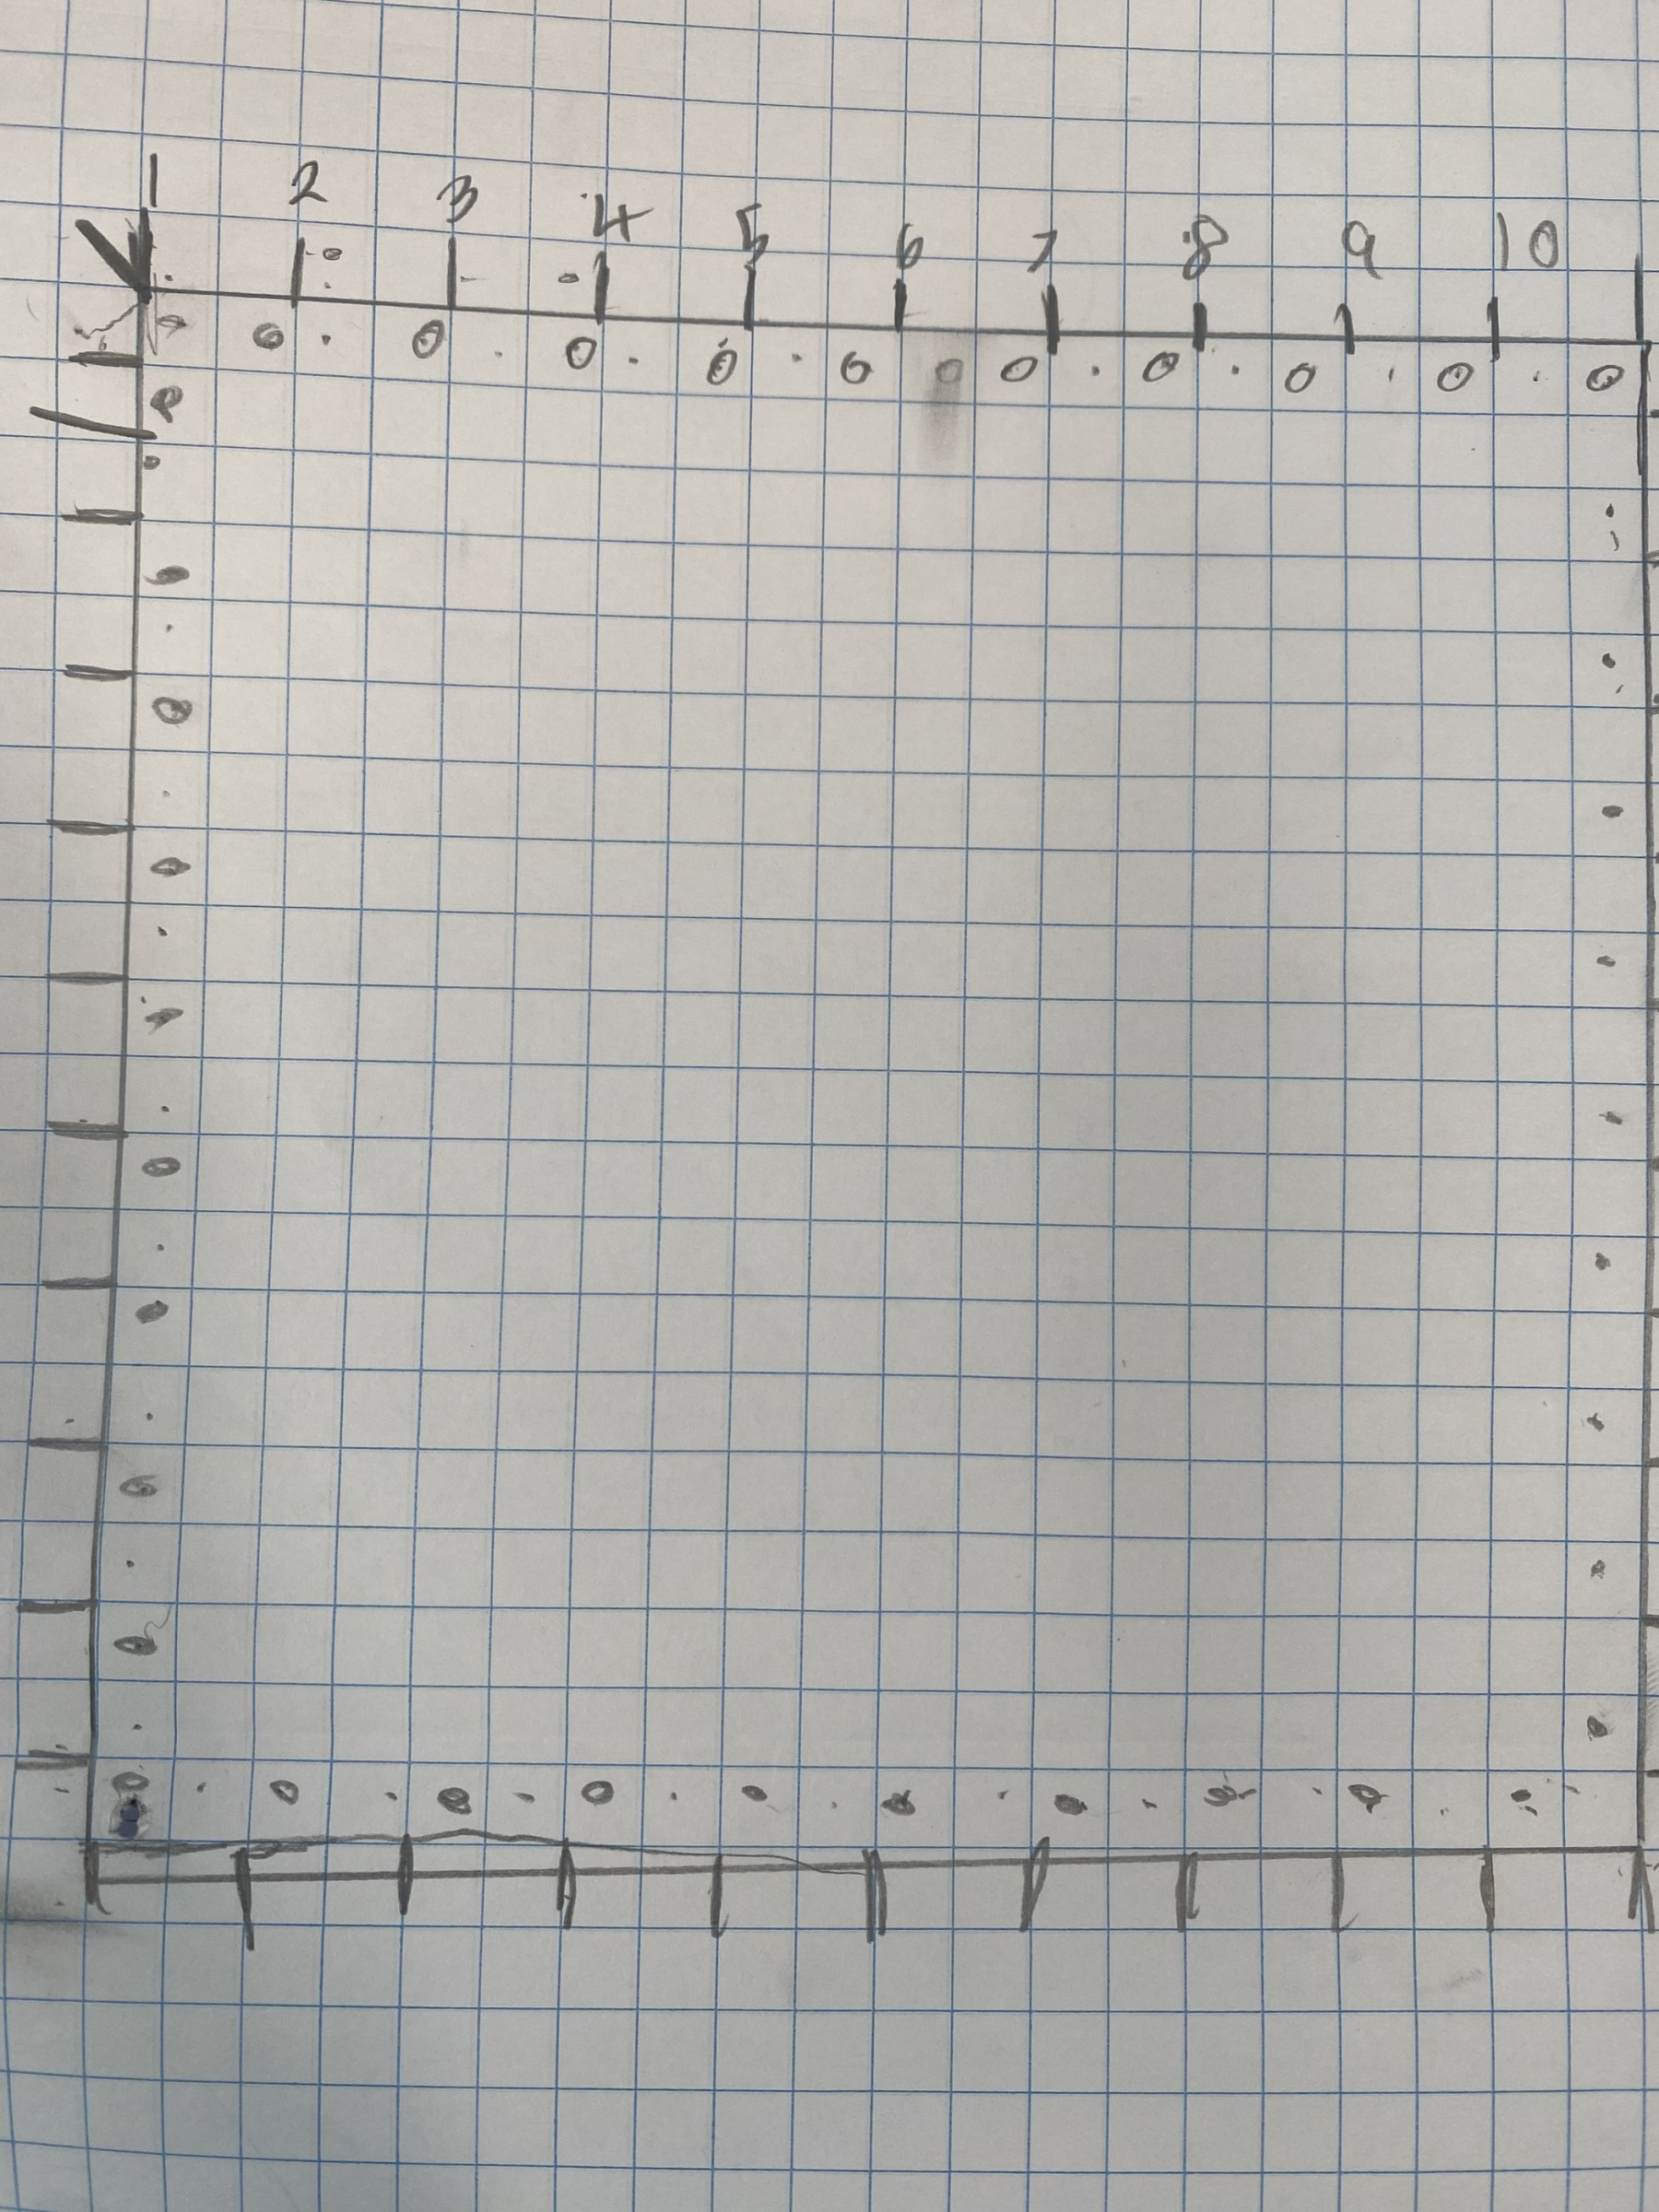
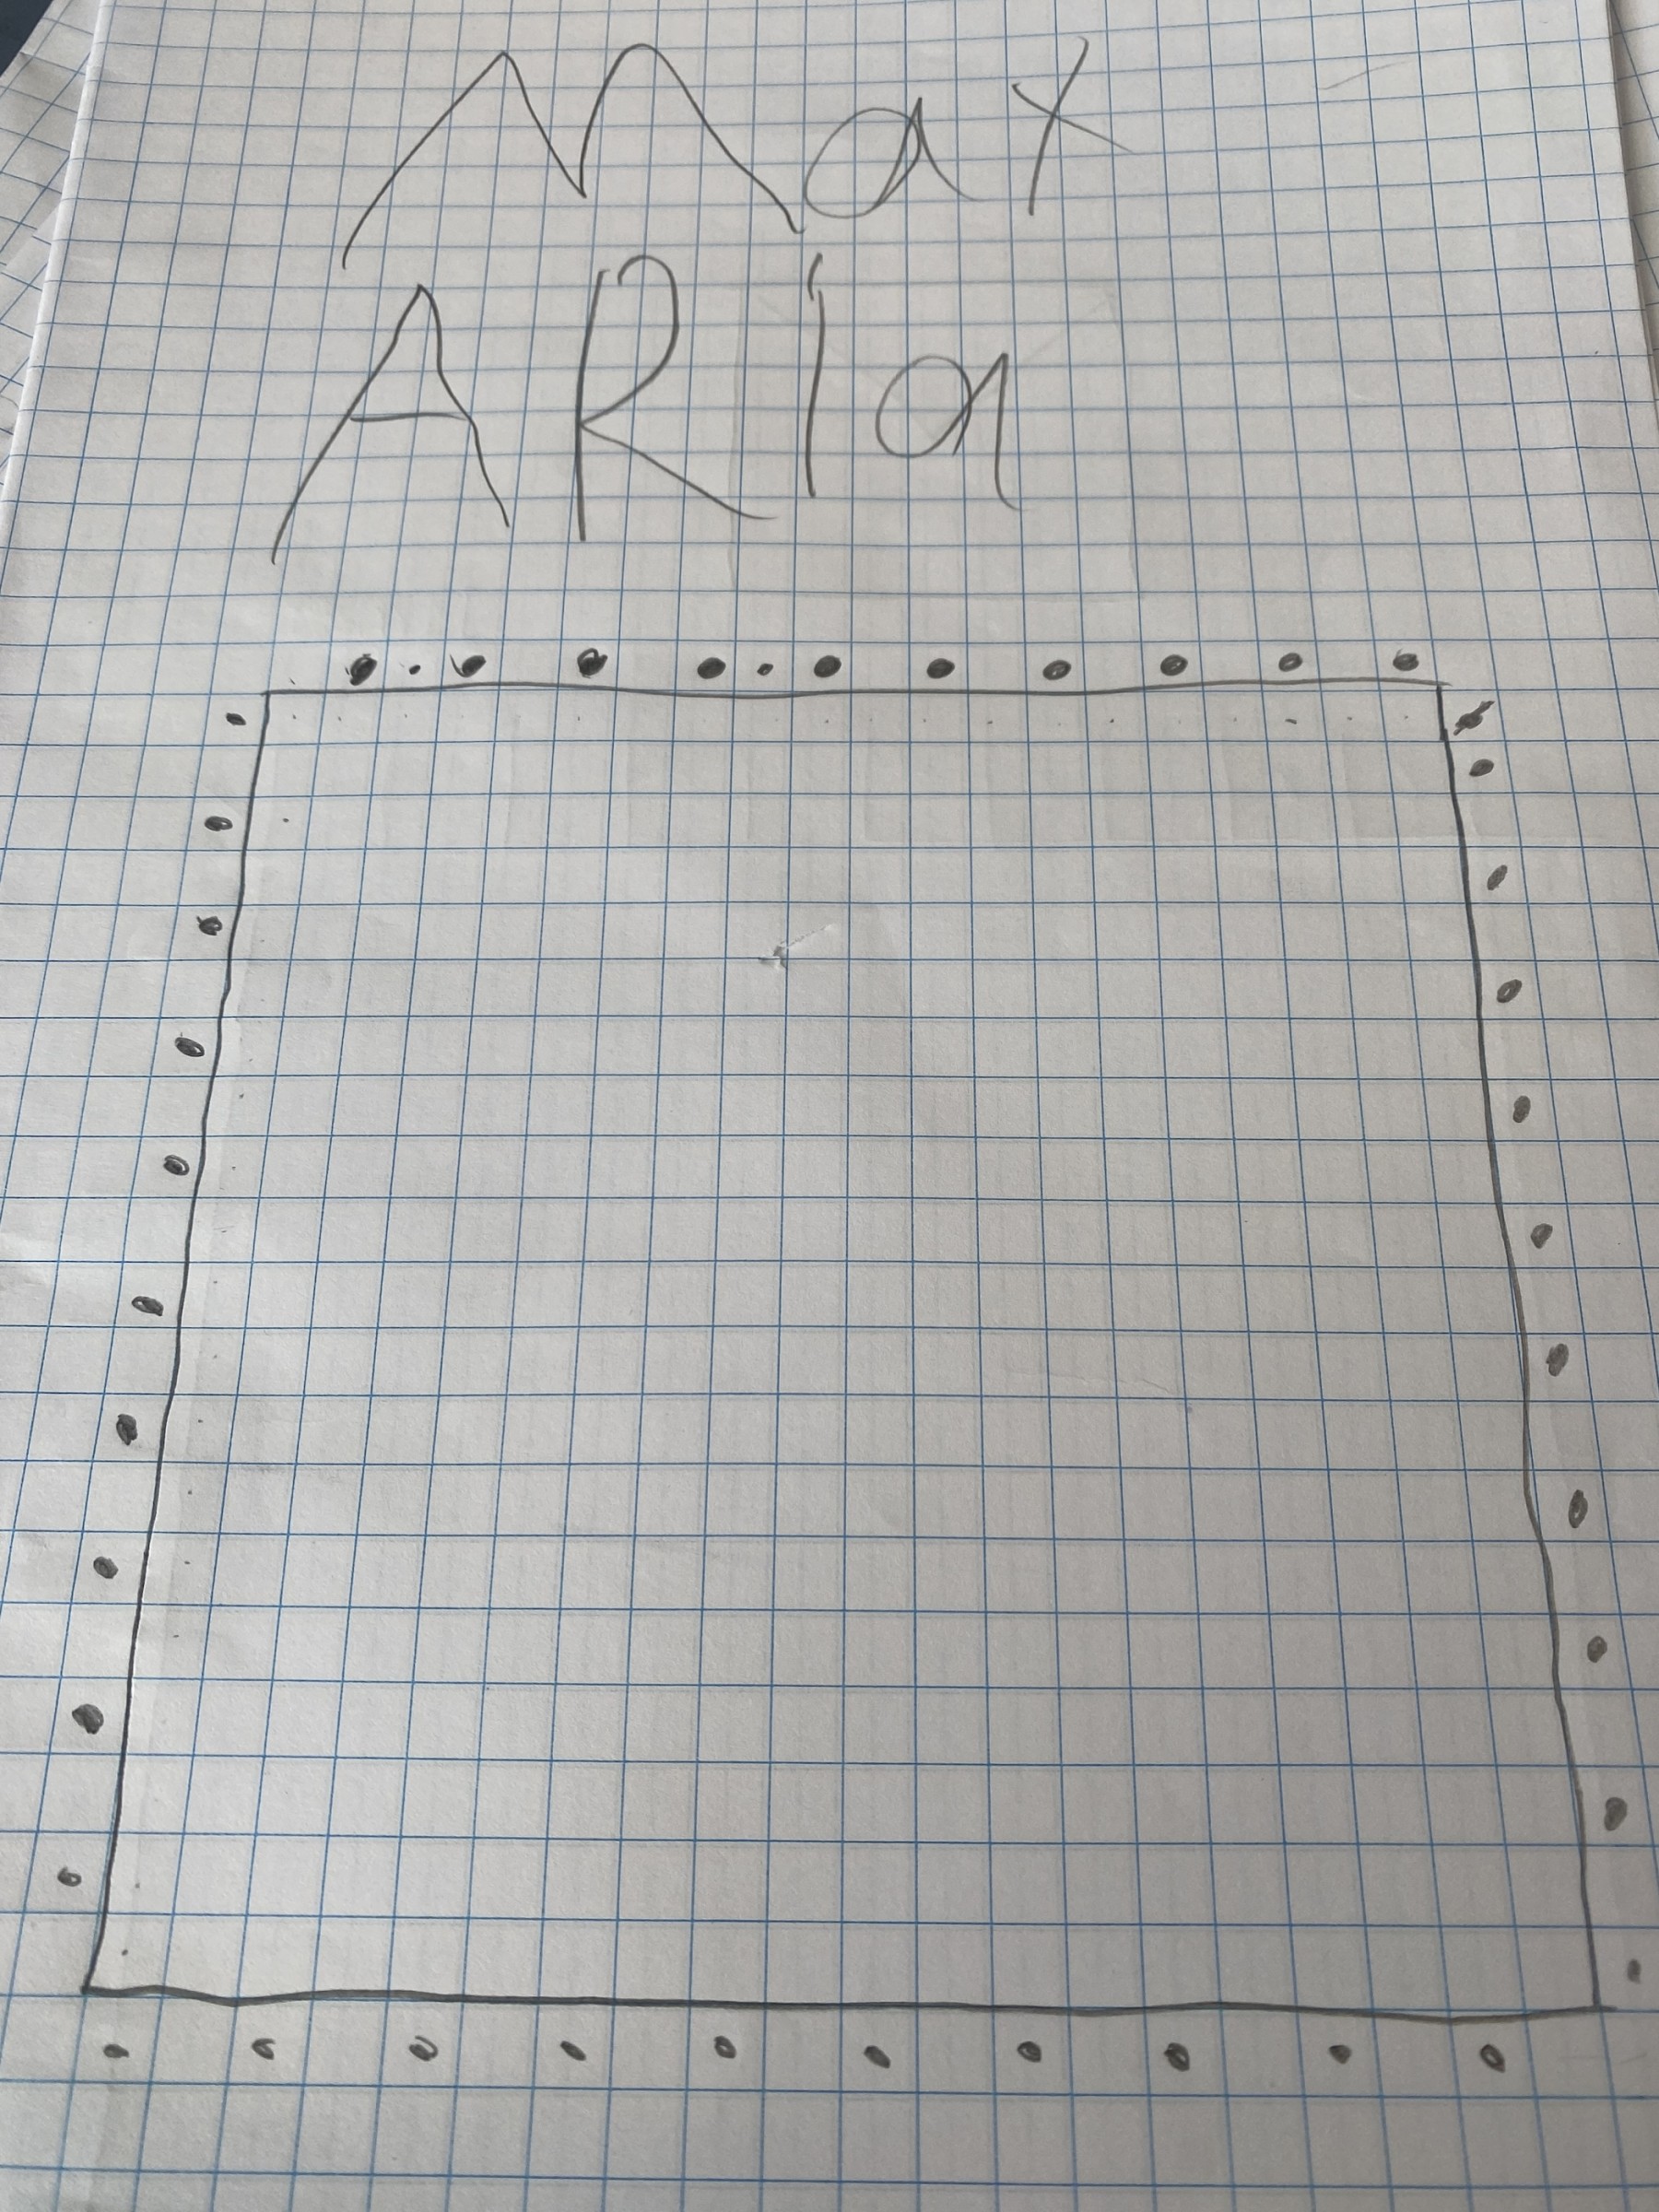
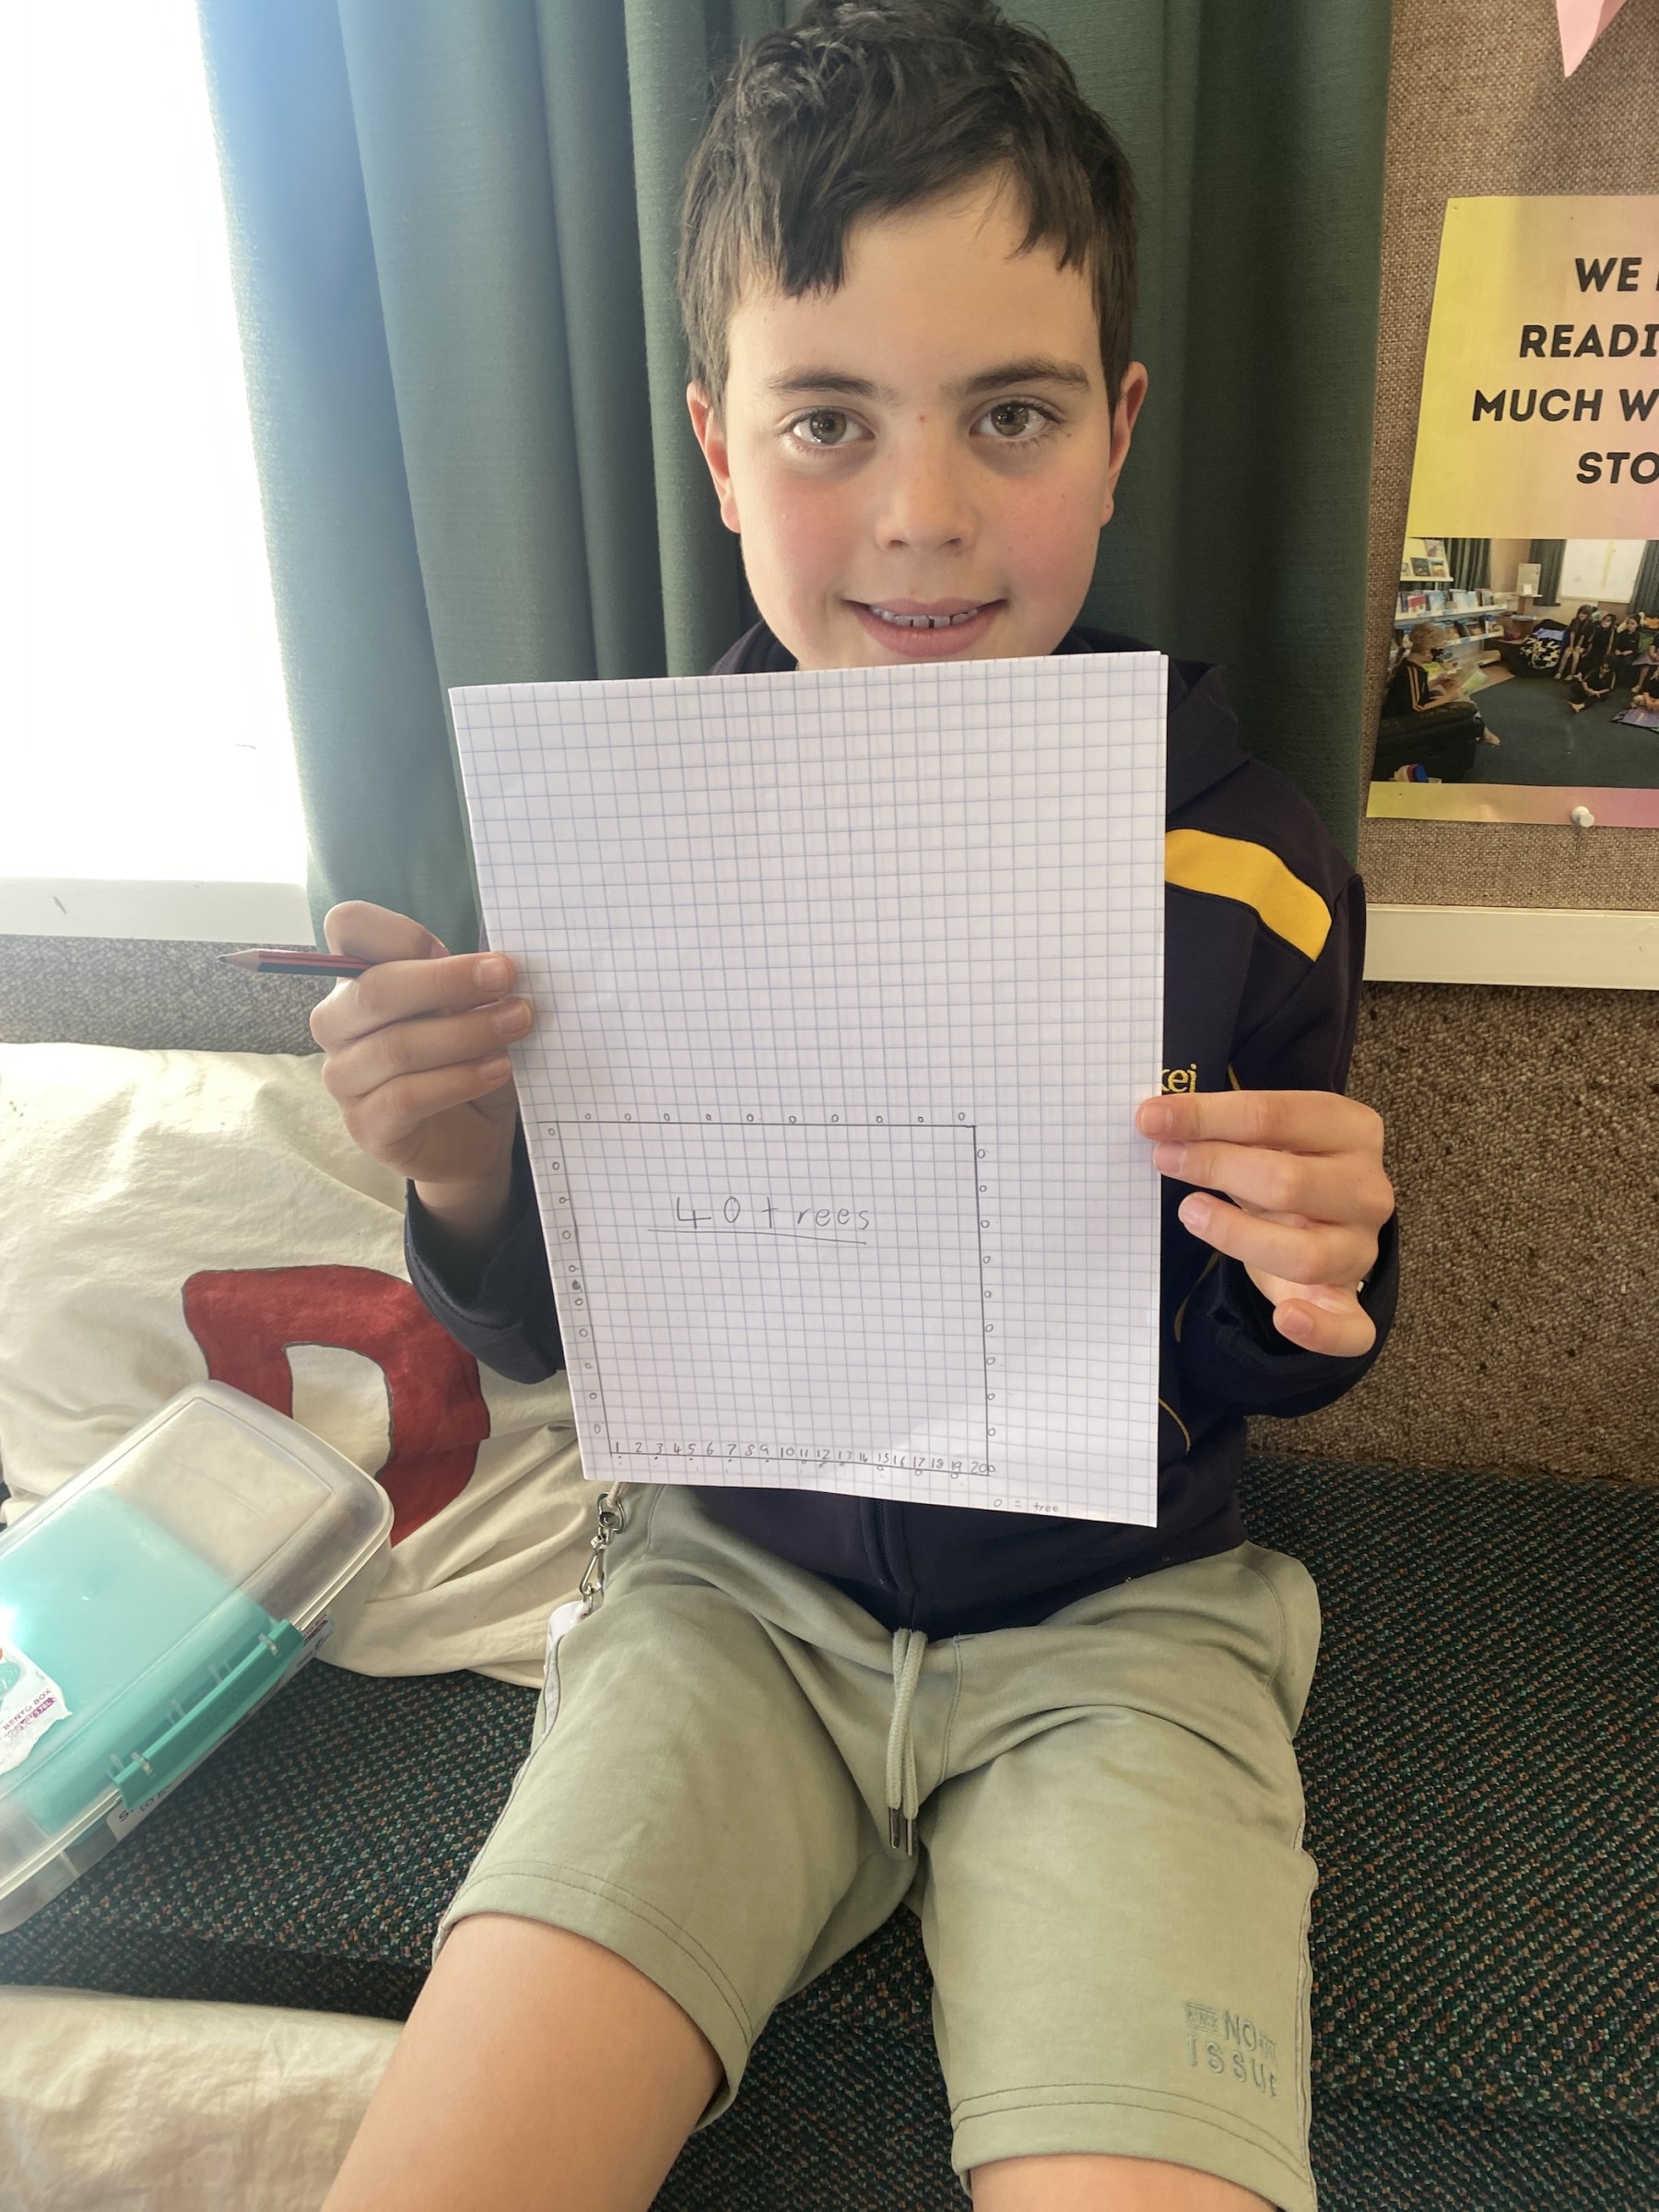
“Look, I finally got 40 trees,” announced Max. “It took me four tries.”
Even Kian and Benjamin were convinced. “We can see the 40 trees now,” agreed Kian.
Now I can see that we first thought there would be 10 trees along the top and bottom, and only room for eight on the sides. This is because we thought the top and bottom would have trees in the corners. I didn’t realise that if I planted a tree at zero, there would be room along the second side for the next tree to start at zero too and so on.
“Grid paper is really helpful,” concluded Benjamin. “Can we take some to the Maths Matters Competition?”
To secure their understanding, students were asked to write their own tree problem where the answer would be 36 trees.
Students agreed that to make Kian’s and Benjamin’s original answer of 36 trees correct, this would need to be the question:
An 18-metre x 18-metre square field has trees planted every 2 metres along its border. How many trees are there?
The grid paper supported students in persevering and reaching their own ‘aha moment’. Students’ own realisations are often more meaningful than teacher comments. Identifying their own errors can feel more authentic and motivating. It is also more likely to stick in their memory because the process engages active problem-solving and creates a stronger mental connection.

Every child deserves to feel valued, respected, and genuinely cared for by their teacher. Creating a classroom where students feel safe, supported, and confident to learn is at the heart of my teaching practice.
I have a passion for all areas of learning, with a particular enthusiasm for mathematics. I enjoy supporting students to make meaningful connections between mathematical ideas, recognise patterns, and develop a deep understanding of how our number system works.
In my classroom, students are encouraged to be brave, collaborative, and open to new challenges. It is a space where taking risks is celebrated, reflection is valued, and success, big or small, is recognised.
Outside of school, I enjoy mountain biking and staying active with my energetic dog, which helps me bring energy and balance to a busy classroom environment. Supporting students to grow, learn, and thrive is at the centre of everything I do, and I am excited to continue this journey at Wairakei Primary School.
Comments
No one has commented on this post yet.